

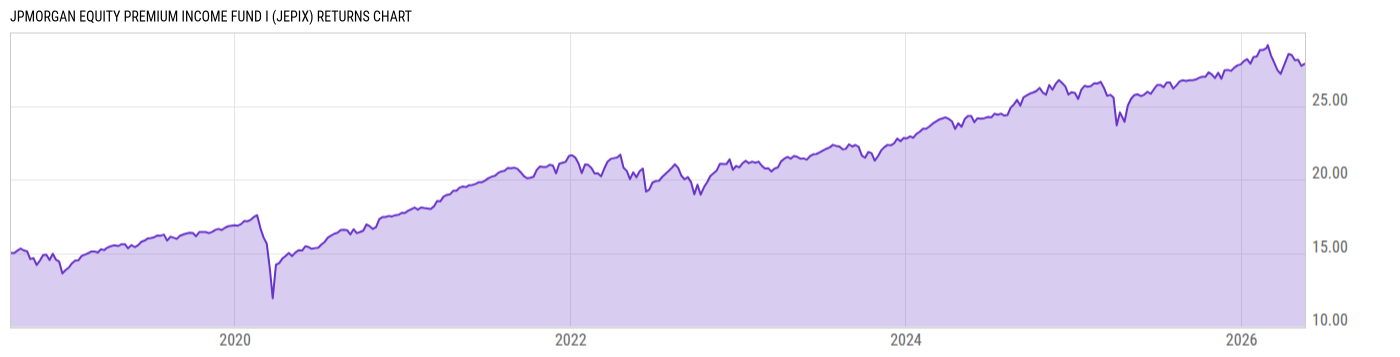
JPMorgan Equity Premium Income Fund I (JEPIX)
13.87
+0.12
(+0.87%)
USD |
Jun 09 2026
Returns Chart
Key Stats
| Net Expense Ratio | Total Assets Under Management | Weighted Average Dividend Yield | Turnover Ratio (Generic) |
|---|---|---|---|
| 0.59% | 5.163B | 1.55% | 178.0% |
| 1 Year Fund Level Flows | 1 Year Total Returns (Daily) | Annualized Total Returns Since Inception (Daily) | Max Drawdown (Since Inception) |
| -1.589B | 7.71% |
Basic Info
| Investment Strategy | |
| The Fund seeks current income while maintaining prospects for capital appreciation. It seeks to provide the majority of the returns associated with the its primary benchmark, the Standard & Poors 500 Total Return Index, while exposing investors to less risk through lower volatility and still offering incremental income. |
| General | |
| Security Type | Mutual Fund |
| Equity Style | Large Cap Core |
| Broad Asset Class | Miscellaneous |
| Broad Category | Alternative Strategies |
| Global Peer Group | Alternative Relative Value |
| Peer Group | Option Income Strategies Funds |
| Global Macro | Liquid Alternatives |
| US Macro | -- |
| YCharts Categorization | -- |
| YCharts Benchmark | -- |
| Prospectus Objective | -- |
| Fund Owner Firm Name | J.P. Morgan Asset Management |
| Broad Asset Class Benchmark Index | |
| ^SPXTR | 100.0% |
Net Fund Flows Versus Peer Group
1 Month
% Rank:
99
-160.82M
Peer Group Low
599.92M
Peer Group High
1 Year
% Rank:
99
-1.589B
-1.686B
Peer Group Low
8.657B
Peer Group High
3 Months
% Rank:
99
-560.96M
Peer Group Low
2.043B
Peer Group High
3 Years
% Rank:
99
-2.299B
Peer Group Low
24.97B
Peer Group High
6 Months
% Rank:
99
-1.040B
Peer Group Low
4.312B
Peer Group High
5 Years
% Rank:
6
-24.19M
Peer Group Low
32.89B
Peer Group High
YTD
% Rank:
99
-926.77M
Peer Group Low
3.902B
Peer Group High
10 Years
% Rank:
6
-90.41M
Peer Group Low
34.57B
Peer Group High
Date Unavailable
Risk
Performance Versus Peer Group
Annual Total Returns Versus Peers
As of June 10, 2026.
Asset Allocation
As of April 30, 2026.
| Type | % Net |
|---|---|
| Cash | 0.69% |
| Stock | 87.90% |
| Bond | 0.07% |
| Convertible | 0.00% |
| Preferred | 0.00% |
| Other | 11.33% |
Top 10 Holdings
| Name | % Weight | Price | % Change |
|---|---|---|---|
| Alphabet, Inc. | 1.83% | 364.98 | 0.20% |
| Amazon.com, Inc. | 1.77% | 241.00 | -1.31% |
| NextEra Energy, Inc. | 1.72% | 84.77 | -0.07% |
| Eaton Corp. Plc | 1.71% | 390.64 | -2.76% |
| Ross Stores, Inc. | 1.71% | 232.91 | 1.51% |
| Broadcom Inc. | 1.68% | 377.20 | -3.81% |
| Trane Technologies Plc | 1.67% | 469.55 | -0.26% |
| EOG Resources, Inc. | 1.63% | 140.57 | 2.36% |
| Howmet Aerospace, Inc. | 1.63% | 252.87 | -1.67% |
| NVIDIA Corp. | 1.60% | 206.02 | -1.04% |
Fees & Availability
| Fees | |
| Actual 12B-1 Fee | -- |
| Actual Management Fee | 0.25% |
| Administration Fee | 3.28M% |
| Maximum Front Load | -- |
| Maximum Deferred Load | -- |
| Maximum Redemption Fee | -- |
| General Availability | |
| Available for Insurance Product | No |
| Available for RRSP | No |
| Purchase Details | |
| Open to New Investors |
|
| Minimum Initial Investment | 1.00M None |
| Minimum Subsequent Investment | 0.00 None |
Basic Info
| Investment Strategy | |
| The Fund seeks current income while maintaining prospects for capital appreciation. It seeks to provide the majority of the returns associated with the its primary benchmark, the Standard & Poors 500 Total Return Index, while exposing investors to less risk through lower volatility and still offering incremental income. |
| General | |
| Security Type | Mutual Fund |
| Equity Style | Large Cap Core |
| Broad Asset Class | Miscellaneous |
| Broad Category | Alternative Strategies |
| Global Peer Group | Alternative Relative Value |
| Peer Group | Option Income Strategies Funds |
| Global Macro | Liquid Alternatives |
| US Macro | -- |
| YCharts Categorization | -- |
| YCharts Benchmark | -- |
| Prospectus Objective | -- |
| Fund Owner Firm Name | J.P. Morgan Asset Management |
| Broad Asset Class Benchmark Index | |
| ^SPXTR | 100.0% |
Fundamentals
| General | |
| Distribution Yield | -- |
| Dividend Yield TTM (6-8-26) | 8.11% |
| 30-Day SEC Yield (5-31-26) | 8.33% |
| 7-Day SEC Yield | -- |
| Number of Holdings | 123 |
| Stock | |
| Weighted Average PE Ratio | 32.45 |
| Weighted Average Price to Sales Ratio | 6.712 |
| Weighted Average Price to Book Ratio | 9.164 |
| Weighted Median ROE | 149.1% |
| Weighted Median ROA | 12.66% |
| ROI (TTM) | 18.17% |
| Return on Investment (TTM) | 18.17% |
| Earning Yield | 0.0369 |
| LT Debt / Shareholders Equity | 0.7631 |
| Number of Equity Holdings | 106 |
As of April 30, 2026
Growth Metrics
| EPS Growth (1Y) | 22.00% |
| EPS Growth (3Y) | 15.84% |
| EPS Growth (5Y) | 18.05% |
| Sales Growth (1Y) | 10.56% |
| Sales Growth (3Y) | 9.11% |
| Sales Growth (5Y) | 11.09% |
| Sales per Share Growth (1Y) | 11.10% |
| Sales per Share Growth (3Y) | 9.78% |
| Operating Cash Flow - Growth Rate (3Y) | 15.84% |
As of April 30, 2026
Fund Details
Top Portfolio Holders
| Name | % Weight |
|---|---|
| Portfolio A | 5.00% |
| Portfolio B | 3.50% |
| Portfolio C | 2.25% |
Excel Add-In Codes
| Name: =YCI("M:JEPIX", "name") |
| Broad Asset Class: =YCI("M:JEPIX", "broad_asset_class") |
| Broad Category: =YCI("M:JEPIX", "broad_category_group") |
| Prospectus Objective: =YCI("M:JEPIX", "prospectus_objective") |
| To find the codes for any of our securities and financial metrics, see our Complete Excel Reference. |