

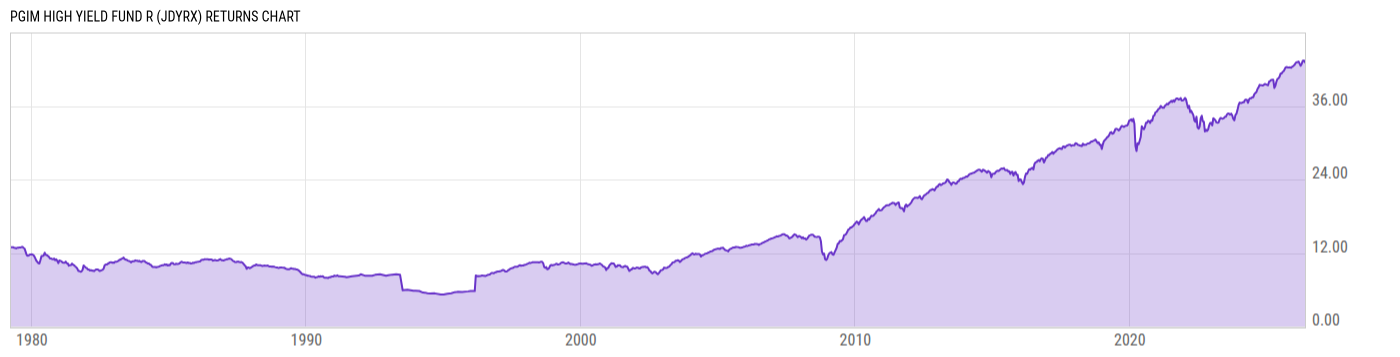
PGIM High Yield Fund R (JDYRX)
4.78
+0.01
(+0.21%)
USD |
Jun 09 2026
Returns Chart
Key Stats
| Net Expense Ratio | Total Assets Under Management | Weighted Average Dividend Yield | Turnover Ratio (Generic) |
|---|---|---|---|
| 1.05% | 22.28B | -- | 49.00% |
| 1 Year Fund Level Flows | 1 Year Total Returns (Daily) | Annualized Total Returns Since Inception (Daily) | Max Drawdown (Since Inception) |
| 1.311B | 6.51% |
Basic Info
| Investment Strategy | |
| The Fund seeks to maximize current income. Capital appreciation is its secondary objective, but only when consistent with the Fund's primary investment objective of current income. The Fund invests at least 80% of its assets in a diversified portfolio of high yield fixed income instruments rated below investment grade. |
| General | |
| Security Type | Mutual Fund |
| Equity Style | -- |
| Broad Asset Class | Taxable Bond |
| Broad Category | Fixed Income |
| Global Peer Group | Bond USD High Yield |
| Peer Group | High Yield Funds |
| Global Macro | Bond High Yield |
| US Macro | High Yield Funds |
| YCharts Categorization | -- |
| YCharts Benchmark | -- |
| Prospectus Objective | High Yield Funds |
| Fund Owner Firm Name | PGIM |
| Broad Asset Class Benchmark Index | |
| ^BBUSATR | 100.0% |
Net Fund Flows Versus Peer Group
1 Month
% Rank:
8
-2.560B
Peer Group Low
510.03M
Peer Group High
1 Year
% Rank:
6
1.311B
-2.841B
Peer Group Low
12.05B
Peer Group High
3 Months
% Rank:
1
-2.713B
Peer Group Low
900.82M
Peer Group High
3 Years
% Rank:
58
-4.326B
Peer Group Low
13.55B
Peer Group High
6 Months
% Rank:
5
-2.877B
Peer Group Low
1.301B
Peer Group High
5 Years
% Rank:
91
-9.174B
Peer Group Low
14.79B
Peer Group High
YTD
% Rank:
5
-4.190B
Peer Group Low
1.217B
Peer Group High
10 Years
% Rank:
2
-9.701B
Peer Group Low
21.92B
Peer Group High
Date Unavailable
Risk
Performance Versus Peer Group
Annual Total Returns Versus Peers
As of June 10, 2026.
Asset Allocation
As of March 31, 2026.
| Type | % Net |
|---|---|
| Cash | 0.06% |
| Stock | 1.57% |
| Bond | 95.80% |
| Convertible | 0.00% |
| Preferred | 0.41% |
| Other | 2.17% |
Top 10 Holdings
| Name | % Weight | Price | % Change |
|---|---|---|---|
| PGIM Active High Yield Bond ETF | 2.28% | 34.90 | 0.17% |
| United States of America USGB 3.375 02/29/2028 FIX USD Government | 1.35% | 98.78 | 0.04% |
|
PGIM Core Government Money Market Fund
|
1.16% | -- | -- |
| PGIM AAA CLO ETF | 1.04% | 51.36 | 0.00% |
|
Digicel International Finance Ltd
|
0.93% | -- | -- |
|
Radiate HoldCo LLC FRN 25-Sep-2029
|
0.91% | -- | -- |
| DISH DBS Corporation DISHN-DDBSC 7.75 07/01/2026 FIX USD Corporate | 0.79% | 100.39 | 0.54% |
| United States of America USGB 3.875 03/31/2028 FIX USD Government | 0.68% | 99.56 | 0.06% |
|
Ferrellgas Escrow LLC FRN 30-Mar-2031
|
0.66% | -- | -- |
| Carvana Co. CARVCO 9.0 06/01/2031 VAR USD Corporate 144A | 0.65% | 109.98 | 0.02% |
Fees & Availability
| Fees | |
| Actual 12B-1 Fee | 0.75% |
| Actual Management Fee | 0.11% |
| Administration Fee | -- |
| Maximum Front Load | -- |
| Maximum Deferred Load | -- |
| Maximum Redemption Fee | -- |
| General Availability | |
| Available for Insurance Product | No |
| Available for RRSP | No |
| Purchase Details | |
| Open to New Investors | No |
| Minimum Initial Investment | 0.00 None |
| Minimum Subsequent Investment | 0.00 None |
Basic Info
| Investment Strategy | |
| The Fund seeks to maximize current income. Capital appreciation is its secondary objective, but only when consistent with the Fund's primary investment objective of current income. The Fund invests at least 80% of its assets in a diversified portfolio of high yield fixed income instruments rated below investment grade. |
| General | |
| Security Type | Mutual Fund |
| Equity Style | -- |
| Broad Asset Class | Taxable Bond |
| Broad Category | Fixed Income |
| Global Peer Group | Bond USD High Yield |
| Peer Group | High Yield Funds |
| Global Macro | Bond High Yield |
| US Macro | High Yield Funds |
| YCharts Categorization | -- |
| YCharts Benchmark | -- |
| Prospectus Objective | High Yield Funds |
| Fund Owner Firm Name | PGIM |
| Broad Asset Class Benchmark Index | |
| ^BBUSATR | 100.0% |
Fundamentals
| General | |
| Distribution Yield | -- |
| Dividend Yield TTM (6-8-26) | 6.43% |
| 30-Day SEC Yield (4-30-26) | 5.67% |
| 7-Day SEC Yield | -- |
| Number of Holdings | 895 |
| Bond | |
| Yield to Maturity (3-31-26) | 6.77% |
| Effective Duration | 2.71 |
| Average Coupon | 6.54% |
| Calculated Average Quality | 5.386 |
| Effective Maturity | 4.135 |
| Nominal Maturity | 4.665 |
| Number of Bond Holdings | 831 |
As of March 31, 2026
Fund Details
| Key Dates | |
| Inception Date | 3/1/1996 |
| Last Annual Report Date | 8/31/2025 |
| Last Prospectus Date | 10/30/2025 |
| Share Classes | |
| PBHAX | A |
| PHYEX | Retirement |
| PHYGX | Retirement |
| PHYQX | Retirement |
| PHYZX | Z |
| PRHCX | C |
| Attributes | |
| Index Fund | -- |
| Inverse Fund | No |
| Leveraged Fund | -- |
| Fund of Funds | No |
| Currency Hedged Fund | -- |
| Socially Responsible Fund | No |
Top Portfolio Holders
| Name | % Weight |
|---|---|
| Portfolio A | 5.00% |
| Portfolio B | 3.50% |
| Portfolio C | 2.25% |
Excel Add-In Codes
| Name: =YCI("M:JDYRX", "name") |
| Broad Asset Class: =YCI("M:JDYRX", "broad_asset_class") |
| Broad Category: =YCI("M:JDYRX", "broad_category_group") |
| Prospectus Objective: =YCI("M:JDYRX", "prospectus_objective") |
| To find the codes for any of our securities and financial metrics, see our Complete Excel Reference. |