

PGIM Jennison Value Fund R (JDVRX)
26.53
+0.07
(+0.26%)
USD |
Jun 09 2026
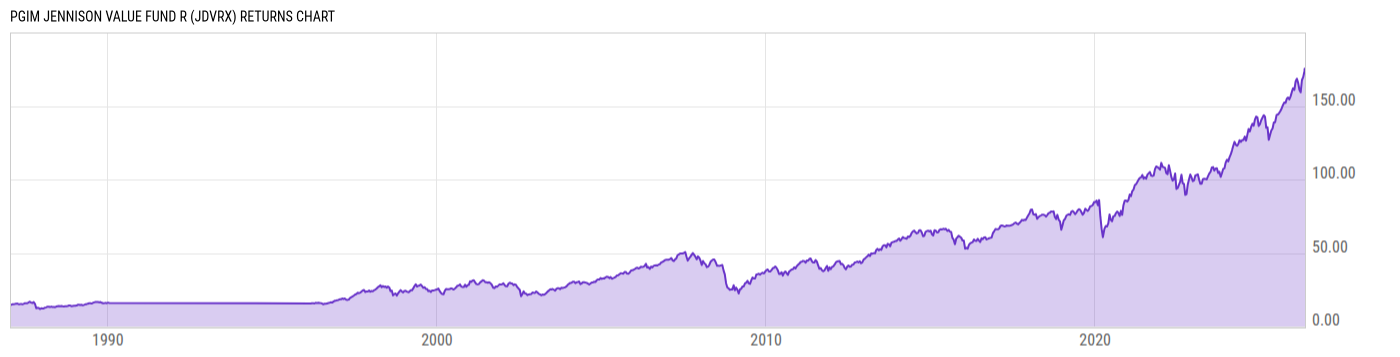
Returns Chart
Key Stats
| Net Expense Ratio | Total Assets Under Management | Weighted Average Dividend Yield | Turnover Ratio (Generic) |
|---|---|---|---|
| 1.16% | 760.86M | 1.79% | 46.00% |
| 1 Year Fund Level Flows | 1 Year Total Returns (Daily) | Annualized Total Returns Since Inception (Daily) | Max Drawdown (Since Inception) |
| -41.36M | 29.14% |
Basic Info
| Investment Strategy | |
| The Fund seeks capital appreciation by investing primarily in stocks and convertible securities that provide investment income returns above those of the Standard & Poor's 500 Stock Index or the NYSE Composite Index. The Fund invests in large capitalization companies with market capitalizations of $1 billion or more. |
| General | |
| Security Type | Mutual Fund |
| Equity Style | Large Cap Value |
| Broad Asset Class | US Equity |
| Broad Category | Equity |
| Global Peer Group | Equity US |
| Peer Group | Large-Cap Value Funds |
| Global Macro | Equity North America |
| US Macro | Large-Cap Funds |
| YCharts Categorization | -- |
| YCharts Benchmark | -- |
| Prospectus Objective | -- |
| Fund Owner Firm Name | PGIM |
| Broad Asset Class Benchmark Index | |
| ^SPXTR | 100.0% |
Net Fund Flows Versus Peer Group
1 Month
% Rank:
41
-2.054B
Peer Group Low
762.58M
Peer Group High
1 Year
% Rank:
46
-41.36M
-11.38B
Peer Group Low
3.607B
Peer Group High
3 Months
% Rank:
38
-3.984B
Peer Group Low
866.43M
Peer Group High
3 Years
% Rank:
36
-30.28B
Peer Group Low
19.54B
Peer Group High
6 Months
% Rank:
41
-7.675B
Peer Group Low
2.255B
Peer Group High
5 Years
% Rank:
40
-41.75B
Peer Group Low
19.54B
Peer Group High
YTD
% Rank:
41
-6.233B
Peer Group Low
2.177B
Peer Group High
10 Years
% Rank:
44
-42.23B
Peer Group Low
19.54B
Peer Group High
Date Unavailable
Risk
Performance Versus Peer Group
Annual Total Returns Versus Peers
As of June 10, 2026.
Asset Allocation
As of April 30, 2026.
| Type | % Net |
|---|---|
| Cash | -0.11% |
| Stock | 98.71% |
| Bond | 0.00% |
| Convertible | 0.00% |
| Preferred | 0.00% |
| Other | 1.41% |
Top 10 Holdings
| Name | % Weight | Price | % Change |
|---|---|---|---|
| JPMorgan Chase & Co. | 4.30% | 309.19 | -1.12% |
| Alphabet, Inc. | 4.23% | 356.50 | -2.13% |
| Walmart, Inc. | 3.13% | 120.58 | 1.43% |
| Advanced Micro Devices, Inc. | 2.69% | 452.36 | -4.87% |
| NiSource, Inc. | 2.68% | 46.61 | 0.60% |
| Exxon Mobil Corp. | 2.50% | 150.66 | 1.18% |
| Cisco Systems, Inc. | 2.38% | 118.81 | -1.29% |
| The Goldman Sachs Group, Inc. | 2.14% | 1000.32 | -3.07% |
| Amazon.com, Inc. | 2.13% | 237.99 | -2.54% |
| Johnson Controls International Plc | 2.13% | 139.43 | -5.63% |
Fees & Availability
| Fees | |
| Actual 12B-1 Fee | 0.75% |
| Actual Management Fee | 0.15% |
| Administration Fee | -- |
| Maximum Front Load | -- |
| Maximum Deferred Load | -- |
| Maximum Redemption Fee | -- |
| General Availability | |
| Available for Insurance Product | No |
| Available for RRSP | No |
| Purchase Details | |
| Open to New Investors | No |
| Minimum Initial Investment | 0.00 None |
| Minimum Subsequent Investment | 0.00 None |
Basic Info
| Investment Strategy | |
| The Fund seeks capital appreciation by investing primarily in stocks and convertible securities that provide investment income returns above those of the Standard & Poor's 500 Stock Index or the NYSE Composite Index. The Fund invests in large capitalization companies with market capitalizations of $1 billion or more. |
| General | |
| Security Type | Mutual Fund |
| Equity Style | Large Cap Value |
| Broad Asset Class | US Equity |
| Broad Category | Equity |
| Global Peer Group | Equity US |
| Peer Group | Large-Cap Value Funds |
| Global Macro | Equity North America |
| US Macro | Large-Cap Funds |
| YCharts Categorization | -- |
| YCharts Benchmark | -- |
| Prospectus Objective | -- |
| Fund Owner Firm Name | PGIM |
| Broad Asset Class Benchmark Index | |
| ^SPXTR | 100.0% |
Fundamentals
| General | |
| Distribution Yield | -- |
| Dividend Yield TTM (6-8-26) | 0.38% |
| 30-Day SEC Yield (4-30-26) | 0.73% |
| 7-Day SEC Yield | -- |
| Number of Holdings | 69 |
| Stock | |
| Weighted Average PE Ratio | 29.43 |
| Weighted Average Price to Sales Ratio | 6.072 |
| Weighted Average Price to Book Ratio | 6.909 |
| Weighted Median ROE | 104.4% |
| Weighted Median ROA | 8.27% |
| ROI (TTM) | 13.25% |
| Return on Investment (TTM) | 13.25% |
| Earning Yield | 0.0431 |
| LT Debt / Shareholders Equity | 0.9040 |
| Number of Equity Holdings | 65 |
As of April 30, 2026
Growth Metrics
| EPS Growth (1Y) | 23.44% |
| EPS Growth (3Y) | 11.23% |
| EPS Growth (5Y) | 16.95% |
| Sales Growth (1Y) | 10.14% |
| Sales Growth (3Y) | 5.68% |
| Sales Growth (5Y) | 9.03% |
| Sales per Share Growth (1Y) | 11.11% |
| Sales per Share Growth (3Y) | 6.57% |
| Operating Cash Flow - Growth Rate (3Y) | 8.93% |
As of April 30, 2026
Fund Details
Top Portfolio Holders
| Name | % Weight |
|---|---|
| Portfolio A | 5.00% |
| Portfolio B | 3.50% |
| Portfolio C | 2.25% |
Excel Add-In Codes
| Name: =YCI("M:JDVRX", "name") |
| Broad Asset Class: =YCI("M:JDVRX", "broad_asset_class") |
| Broad Category: =YCI("M:JDVRX", "broad_category_group") |
| Prospectus Objective: =YCI("M:JDVRX", "prospectus_objective") |
| To find the codes for any of our securities and financial metrics, see our Complete Excel Reference. |