

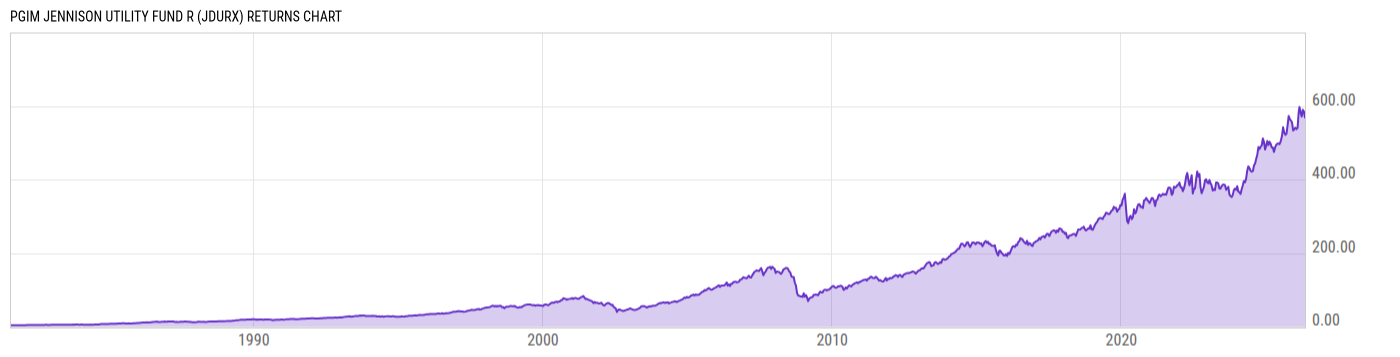
PGIM Jennison Utility Fund R (JDURX)
15.62
-0.07
(-0.45%)
USD |
May 29 2026
Returns Chart
Key Stats
| Net Expense Ratio | Total Assets Under Management | Weighted Average Dividend Yield | Turnover Ratio (Generic) |
|---|---|---|---|
| 1.10% | 3.322B | 2.14% | 37.00% |
| 1 Year Fund Level Flows | 1 Year Total Returns (Daily) | Annualized Total Returns Since Inception (Daily) | Max Drawdown (Since Inception) |
| -313.10M | 12.94% |
Basic Info
| Investment Strategy | |
| The Fund seeks total return through a combination of capital appreciation and current income. The Fund invests in equity-related and investment-grade debt securities of utility companies. Utility investments can be affected by government regulations, the price of fuel, environmental factors, and interest rates. |
| General | |
| Security Type | Mutual Fund |
| Equity Style | Multi Cap Value |
| Broad Asset Class | Sector Equity |
| Broad Category | Equity |
| Global Peer Group | Equity Sector Utilities |
| Peer Group | Utility Funds |
| Global Macro | Equity Industry Sector |
| US Macro | Sector Equity Funds |
| YCharts Categorization | -- |
| YCharts Benchmark | -- |
| Prospectus Objective | Utility Funds |
| Fund Owner Firm Name | PGIM |
| Broad Asset Class Benchmark Index | |
| ^MSWNTR | 100.0% |
Net Fund Flows Versus Peer Group
1 Month
% Rank:
70
-852.74M
Peer Group Low
89.43M
Peer Group High
1 Year
% Rank:
95
-313.10M
-905.33M
Peer Group Low
1.797B
Peer Group High
3 Months
% Rank:
89
-79.81M
Peer Group Low
291.96M
Peer Group High
3 Years
% Rank:
90
-1.563B
Peer Group Low
1.271B
Peer Group High
6 Months
% Rank:
95
-933.62M
Peer Group Low
605.85M
Peer Group High
5 Years
% Rank:
90
-2.052B
Peer Group Low
3.864B
Peer Group High
YTD
% Rank:
95
-1.018B
Peer Group Low
351.15M
Peer Group High
10 Years
% Rank:
78
-4.573B
Peer Group Low
3.953B
Peer Group High
Date Unavailable
Risk
Performance Versus Peer Group
Annual Total Returns Versus Peers
As of May 31, 2026.
Asset Allocation
As of April 30, 2026.
| Type | % Net |
|---|---|
| Cash | 0.01% |
| Stock | 99.14% |
| Bond | 0.00% |
| Convertible | 0.00% |
| Preferred | 0.00% |
| Other | 0.85% |
Top 10 Holdings
| Name | % Weight | Price | % Change |
|---|---|---|---|
| NextEra Energy, Inc. | 13.31% | 87.01 | -0.28% |
| Constellation Energy Corp. | 6.64% | 287.75 | 0.50% |
| Entergy Corp. | 6.28% | 109.05 | -0.52% |
| Sempra | 5.49% | 89.13 | -1.00% |
| CenterPoint Energy, Inc. | 5.13% | 42.26 | 0.09% |
| The Southern Co. | 5.08% | 92.05 | -0.51% |
| Vistra Corp. | 5.06% | 160.23 | -0.03% |
| Ameren Corp. | 4.48% | 107.97 | -0.88% |
| Xcel Energy, Inc. | 4.36% | 79.50 | 0.30% |
| NiSource, Inc. | 4.18% | 46.22 | -1.18% |
Fees & Availability
| Fees | |
| Actual 12B-1 Fee | 0.75% |
| Actual Management Fee | 0.17% |
| Administration Fee | -- |
| Maximum Front Load | -- |
| Maximum Deferred Load | -- |
| Maximum Redemption Fee | -- |
| General Availability | |
| Available for Insurance Product | No |
| Available for RRSP | No |
| Purchase Details | |
| Open to New Investors | No |
| Minimum Initial Investment | 0.00 None |
| Minimum Subsequent Investment | 0.00 None |
Basic Info
| Investment Strategy | |
| The Fund seeks total return through a combination of capital appreciation and current income. The Fund invests in equity-related and investment-grade debt securities of utility companies. Utility investments can be affected by government regulations, the price of fuel, environmental factors, and interest rates. |
| General | |
| Security Type | Mutual Fund |
| Equity Style | Multi Cap Value |
| Broad Asset Class | Sector Equity |
| Broad Category | Equity |
| Global Peer Group | Equity Sector Utilities |
| Peer Group | Utility Funds |
| Global Macro | Equity Industry Sector |
| US Macro | Sector Equity Funds |
| YCharts Categorization | -- |
| YCharts Benchmark | -- |
| Prospectus Objective | Utility Funds |
| Fund Owner Firm Name | PGIM |
| Broad Asset Class Benchmark Index | |
| ^MSWNTR | 100.0% |
Fundamentals
| General | |
| Distribution Yield | -- |
| Dividend Yield TTM (5-28-26) | 1.72% |
| 30-Day SEC Yield (4-30-26) | 1.17% |
| 7-Day SEC Yield | -- |
| Number of Holdings | 34 |
| Stock | |
| Weighted Average PE Ratio | 27.71 |
| Weighted Average Price to Sales Ratio | 3.955 |
| Weighted Average Price to Book Ratio | 4.699 |
| Weighted Median ROE | 10.86% |
| Weighted Median ROA | 2.77% |
| ROI (TTM) | 3.16% |
| Return on Investment (TTM) | 3.16% |
| Earning Yield | 0.0399 |
| LT Debt / Shareholders Equity | 1.780 |
| Number of Equity Holdings | 29 |
As of April 30, 2026
Growth Metrics
| EPS Growth (1Y) | 1.53% |
| EPS Growth (3Y) | 9.96% |
| EPS Growth (5Y) | 10.81% |
| Sales Growth (1Y) | 11.17% |
| Sales Growth (3Y) | 3.02% |
| Sales Growth (5Y) | 7.83% |
| Sales per Share Growth (1Y) | 9.77% |
| Sales per Share Growth (3Y) | 2.27% |
| Operating Cash Flow - Growth Rate (3Y) | 27.93% |
As of April 30, 2026
Fund Details
Top Portfolio Holders
| Name | % Weight |
|---|---|
| Portfolio A | 5.00% |
| Portfolio B | 3.50% |
| Portfolio C | 2.25% |
Excel Add-In Codes
| Name: =YCI("M:JDURX", "name") |
| Broad Asset Class: =YCI("M:JDURX", "broad_asset_class") |
| Broad Category: =YCI("M:JDURX", "broad_category_group") |
| Prospectus Objective: =YCI("M:JDURX", "prospectus_objective") |
| To find the codes for any of our securities and financial metrics, see our Complete Excel Reference. |