

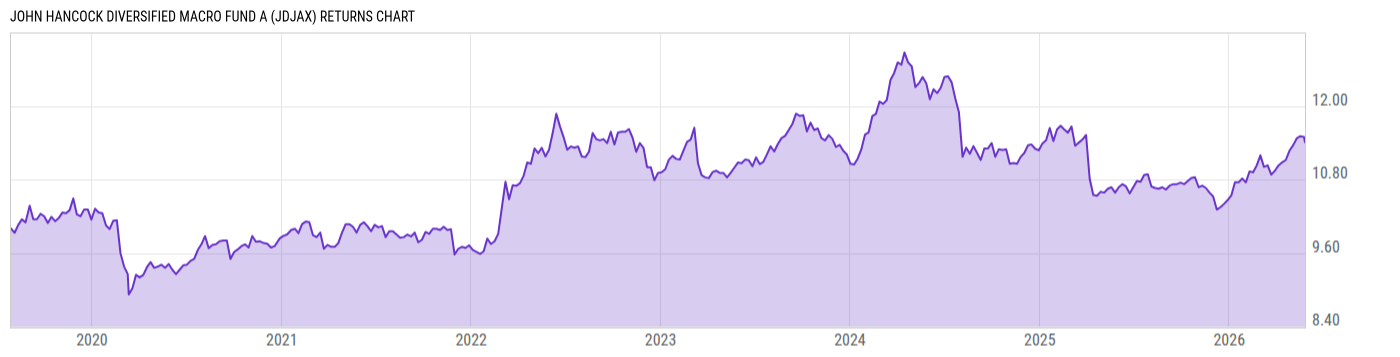
John Hancock Diversified Macro Fund A (JDJAX)
9.08
-0.05
(-0.55%)
USD |
May 27 2026
Returns Chart
Key Stats
| Net Expense Ratio | Total Assets Under Management | Weighted Average Dividend Yield | Turnover Ratio (Generic) |
|---|---|---|---|
| 1.61% | 898.40M | -- | 0.10% |
| 1 Year Fund Level Flows | 1 Year Total Returns (Daily) | Annualized Total Returns Since Inception (Daily) | Max Drawdown (Since Inception) |
| -517.38M | 6.75% |
Basic Info
| Investment Strategy | |
| The Fund seeks long-term capital appreciation. The Fund's investment strategy incorporates a variety of models that generate macro fundamental forecasts, assess yield and earnings differentials, compare current valuations relative to historic fair value, and analyze directional price trends across markets. |
| General | |
| Security Type | Mutual Fund |
| Equity Style | -- |
| Broad Asset Class | Alternative |
| Broad Category | Alternative Strategies |
| Global Peer Group | Alternative Multi Strategies |
| Peer Group | Alternative Multi-Strategy Funds |
| Global Macro | Liquid Alternatives |
| US Macro | Alternative Equity Funds |
| YCharts Categorization | -- |
| YCharts Benchmark | -- |
| Prospectus Objective | Alternative Multi-Strategy Funds |
| Fund Owner Firm Name | John Hancock Group |
| Broad Asset Class Benchmark Index | |
| ^MSACWINTR | 100.0% |
Net Fund Flows Versus Peer Group
1 Month
% Rank:
86
-57.14M
Peer Group Low
449.76M
Peer Group High
1 Year
% Rank:
98
-517.38M
-552.08M
Peer Group Low
4.649B
Peer Group High
3 Months
% Rank:
88
-220.49M
Peer Group Low
1.193B
Peer Group High
3 Years
% Rank:
65
-1.806B
Peer Group Low
6.229B
Peer Group High
6 Months
% Rank:
95
-247.22M
Peer Group Low
2.749B
Peer Group High
5 Years
% Rank:
21
-2.319B
Peer Group Low
6.492B
Peer Group High
YTD
% Rank:
95
-183.82M
Peer Group Low
2.170B
Peer Group High
10 Years
% Rank:
12
-3.287B
Peer Group Low
6.881B
Peer Group High
Date Unavailable
Risk
Performance Versus Peer Group
Annual Total Returns Versus Peers
As of May 28, 2026.
Asset Allocation
As of March 31, 2026.
| Type | % Net |
|---|---|
| Cash | 3.12% |
| Stock | 0.00% |
| Bond | 66.11% |
| Convertible | 0.00% |
| Preferred | 0.00% |
| Other | 30.77% |
Top 10 Holdings
| Name | % Weight | Price | % Change |
|---|---|---|---|
| United States of America USGB 04/16/2026 FIX USD Government (Matured) | 20.84% | 100.00 | 0.01% |
| United States of America USGB 04/23/2026 FIX USD Government (Matured) | 17.50% | 100.00 | 0.01% |
|
Other Assets less Liabilities
|
16.72% | -- | -- |
| United States of America USGB 04/09/2026 FIX USD Government (Matured) | 14.13% | 100.00 | 0.01% |
|
John Hancock Diversified Macro Cayman
|
14.05% | -- | -- |
| United States of America USGB 04/02/2026 FIX USD Government (Matured) | 13.64% | 100.00 | 0.01% |
|
USD Cash
|
2.41% | -- | -- |
|
Merrill Lynch & Co Inc Repo
|
0.66% | -- | -- |
|
CAD Cash
|
0.03% | -- | -- |
|
GBP Cash
|
0.02% | -- | -- |
Fees & Availability
| Fees | |
| Actual 12B-1 Fee | 0.25% |
| Actual Management Fee | 1.17% |
| Administration Fee | -- |
| Maximum Front Load | 5.00% |
| Maximum Deferred Load | -- |
| Maximum Redemption Fee | -- |
| General Availability | |
| Available for Insurance Product | No |
| Available for RRSP | No |
| Purchase Details | |
| Open to New Investors |
|
| Minimum Initial Investment | 1000.00 None |
| Minimum Subsequent Investment | 0.00 None |
Basic Info
| Investment Strategy | |
| The Fund seeks long-term capital appreciation. The Fund's investment strategy incorporates a variety of models that generate macro fundamental forecasts, assess yield and earnings differentials, compare current valuations relative to historic fair value, and analyze directional price trends across markets. |
| General | |
| Security Type | Mutual Fund |
| Equity Style | -- |
| Broad Asset Class | Alternative |
| Broad Category | Alternative Strategies |
| Global Peer Group | Alternative Multi Strategies |
| Peer Group | Alternative Multi-Strategy Funds |
| Global Macro | Liquid Alternatives |
| US Macro | Alternative Equity Funds |
| YCharts Categorization | -- |
| YCharts Benchmark | -- |
| Prospectus Objective | Alternative Multi-Strategy Funds |
| Fund Owner Firm Name | John Hancock Group |
| Broad Asset Class Benchmark Index | |
| ^MSACWINTR | 100.0% |
Fundamentals
| General | |
| Distribution Yield | -- |
| Dividend Yield TTM (5-26-26) | 0.04% |
| 30-Day SEC Yield | -- |
| 7-Day SEC Yield | -- |
| Number of Holdings | 12 |
Fund Details
Top Portfolio Holders
| Name | % Weight |
|---|---|
| Portfolio A | 5.00% |
| Portfolio B | 3.50% |
| Portfolio C | 2.25% |
Excel Add-In Codes
| Name: =YCI("M:JDJAX", "name") |
| Broad Asset Class: =YCI("M:JDJAX", "broad_asset_class") |
| Broad Category: =YCI("M:JDJAX", "broad_category_group") |
| Prospectus Objective: =YCI("M:JDJAX", "prospectus_objective") |
| To find the codes for any of our securities and financial metrics, see our Complete Excel Reference. |