

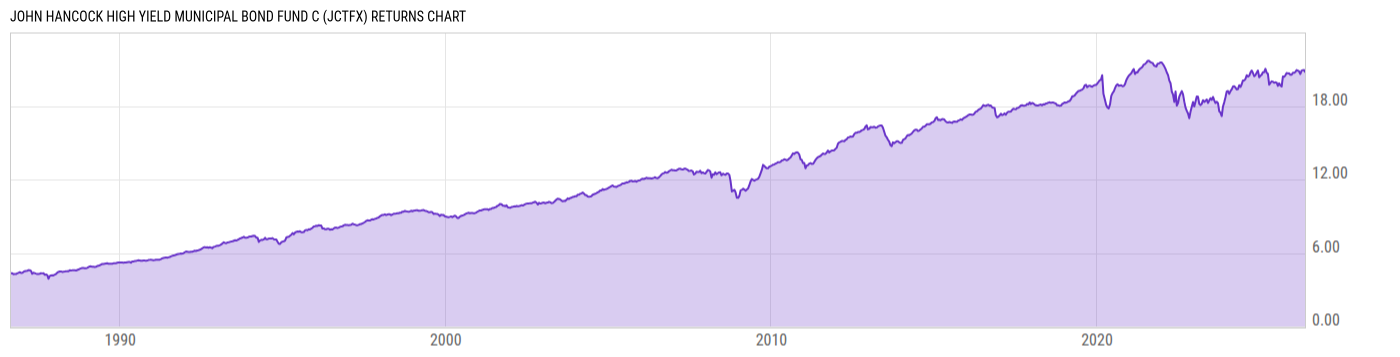
John Hancock High Yield Municipal Bond Fund C (JCTFX)
6.72
+0.01
(+0.15%)
USD |
May 22 2026
Returns Chart
Key Stats
| Net Expense Ratio | Total Assets Under Management | Weighted Average Dividend Yield | Turnover Ratio (Generic) |
|---|---|---|---|
| 1.61% | 506.72M | -- | 34.00% |
| 1 Year Fund Level Flows | 1 Year Total Returns (Daily) | Annualized Total Returns Since Inception (Daily) | Max Drawdown (Since Inception) |
| 151.50M | 4.92% |
Basic Info
| Investment Strategy | |
| The Fund seeks a high level of current income that is largely exempt from federal income tax consistent with preservation of capital. Under normal market conditions, it invests at least 80% of net assets, plus the amount of any borrowings for investment purposes, in municipal bonds. The fund may buy bonds of any maturity. |
| General | |
| Security Type | Mutual Fund |
| Equity Style | -- |
| Broad Asset Class | Municipal Bond |
| Broad Category | Fixed Income |
| Global Peer Group | Bond USD Municipal High Yield |
| Peer Group | High Yield Municipal Debt Funds |
| Global Macro | Bond High Yield |
| US Macro | National Municipal Debt Funds |
| YCharts Categorization | -- |
| YCharts Benchmark | -- |
| Prospectus Objective | High Yield Municipal Debt Funds |
| Fund Owner Firm Name | John Hancock Group |
| Broad Asset Class Benchmark Index | |
| ^BBMBTR | 100.0% |
Net Fund Flows Versus Peer Group
1 Month
% Rank:
50
-447.19M
Peer Group Low
391.76M
Peer Group High
1 Year
% Rank:
35
151.50M
-1.909B
Peer Group Low
2.560B
Peer Group High
3 Months
% Rank:
35
-444.70M
Peer Group Low
760.98M
Peer Group High
3 Years
% Rank:
37
-6.670B
Peer Group Low
6.954B
Peer Group High
6 Months
% Rank:
26
-871.28M
Peer Group Low
1.455B
Peer Group High
5 Years
% Rank:
33
-7.935B
Peer Group Low
10.29B
Peer Group High
YTD
% Rank:
45
-332.34M
Peer Group Low
931.64M
Peer Group High
10 Years
% Rank:
47
-4.571B
Peer Group Low
14.58B
Peer Group High
Date Unavailable
Risk
Performance Versus Peer Group
Annual Total Returns Versus Peers
As of May 24, 2026.
Asset Allocation
As of February 28, 2026.
| Type | % Net |
|---|---|
| Cash | 0.00% |
| Stock | 0.00% |
| Bond | 99.12% |
| Convertible | 0.00% |
| Preferred | 0.00% |
| Other | 0.88% |
Top 10 Holdings
| Name | % Weight | Price | % Change |
|---|---|---|---|
| BLACK BELT ENERGY GAS DIST ALA GAS PROJ REV AL 5.500 11/01/2056 | 1.50% | 105.55 | 0.19% |
| BUCKEYE OHIO TOB SETTLEMENT FING AUTH OH 5.000 06/01/2055 | 1.34% | 78.82 | 0.41% |
| 02/01/2053 | 0.97% | -- | -- |
| PUBLIC FIN AUTH WIS TOLL REV WI 6.500 12/31/2065 | 0.89% | 109.40 | 0.20% |
| PUBLIC FIN AUTH WIS REV WI 0.000 12/15/2036 | 0.83% | 50.60 | 0.38% |
| CALIFORNIA CNTY CALIF TOB SECURITIZATION AGY TOB SETTLEMENT REV CA 0.000 06/01/2055 | 0.80% | 20.04 | 0.91% |
| RED RIV ED FIN CORP TEX HIGHER ED REV TX 5.500 10/01/2046 | 0.78% | 100.00 | -0.13% |
| VIRGIN ISLANDS HOTEL DEV FING CORP HOTEL REV VI 6.000 12/01/2055 | 0.77% | 97.81 | 0.26% |
| LOUISIANA PUB FACS AUTH REV LA 5.000 09/01/2066 | 0.76% | 94.72 | 0.50% |
| 05/01/2049 | 0.73% | -- | -- |
Fees & Availability
| Fees | |
| Actual 12B-1 Fee | 1.00% |
| Actual Management Fee | 0.22% |
| Administration Fee | -- |
| Maximum Front Load | 0.00% |
| Maximum Deferred Load | 1.00% |
| Maximum Redemption Fee | -- |
| General Availability | |
| Available for Insurance Product | No |
| Available for RRSP | No |
| Purchase Details | |
| Open to New Investors |
|
| Minimum Initial Investment | 1000.00 None |
| Minimum Subsequent Investment | 0.00 None |
Basic Info
| Investment Strategy | |
| The Fund seeks a high level of current income that is largely exempt from federal income tax consistent with preservation of capital. Under normal market conditions, it invests at least 80% of net assets, plus the amount of any borrowings for investment purposes, in municipal bonds. The fund may buy bonds of any maturity. |
| General | |
| Security Type | Mutual Fund |
| Equity Style | -- |
| Broad Asset Class | Municipal Bond |
| Broad Category | Fixed Income |
| Global Peer Group | Bond USD Municipal High Yield |
| Peer Group | High Yield Municipal Debt Funds |
| Global Macro | Bond High Yield |
| US Macro | National Municipal Debt Funds |
| YCharts Categorization | -- |
| YCharts Benchmark | -- |
| Prospectus Objective | High Yield Municipal Debt Funds |
| Fund Owner Firm Name | John Hancock Group |
| Broad Asset Class Benchmark Index | |
| ^BBMBTR | 100.0% |
Fundamentals
| General | |
| Distribution Yield | -- |
| Dividend Yield TTM (5-21-26) | 4.38% |
| 30-Day SEC Yield (4-30-26) | 4.46% |
| 7-Day SEC Yield | -- |
| Number of Holdings | 421 |
| Bond | |
| Yield to Maturity (2-28-26) | 5.19% |
| Effective Duration | 9.12 |
| Average Coupon | 5.42% |
| Calculated Average Quality | 4.449 |
| Effective Maturity | 20.38 |
| Nominal Maturity | 24.30 |
| Number of Bond Holdings | 393 |
As of February 28, 2026
Fund Details
Top Portfolio Holders
| Name | % Weight |
|---|---|
| Portfolio A | 5.00% |
| Portfolio B | 3.50% |
| Portfolio C | 2.25% |
Excel Add-In Codes
| Name: =YCI("M:JCTFX", "name") |
| Broad Asset Class: =YCI("M:JCTFX", "broad_asset_class") |
| Broad Category: =YCI("M:JCTFX", "broad_category_group") |
| Prospectus Objective: =YCI("M:JCTFX", "prospectus_objective") |
| To find the codes for any of our securities and financial metrics, see our Complete Excel Reference. |