

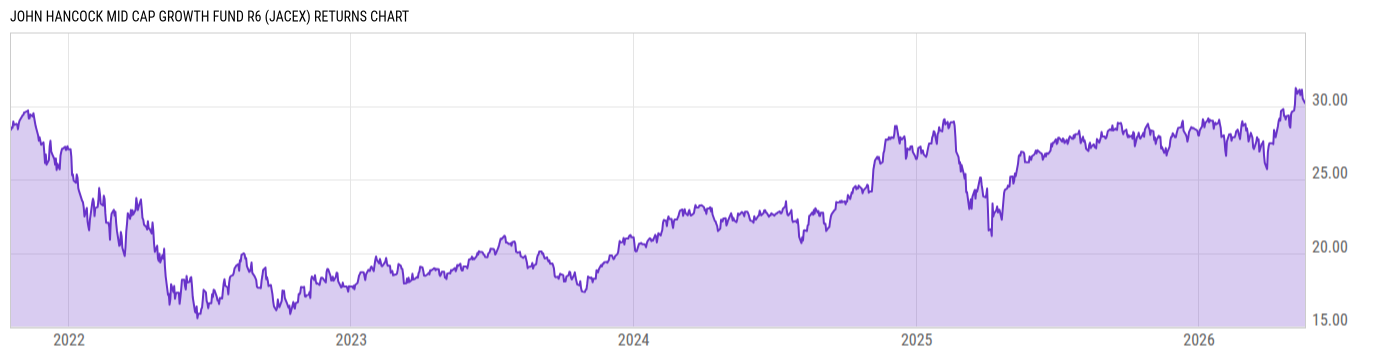
John Hancock Mid Cap Growth Fund R6 (JACEX)
19.80
+0.02
(+0.10%)
USD |
Jun 09 2026
Returns Chart
Key Stats
| Net Expense Ratio | Total Assets Under Management | Weighted Average Dividend Yield | Turnover Ratio (Generic) |
|---|---|---|---|
| 0.81% | 1.246B | 0.28% | 161.0% |
| 1 Year Fund Level Flows | 1 Year Total Returns (Daily) | Annualized Total Returns Since Inception (Daily) | Max Drawdown (Since Inception) |
| -175.05M | 15.93% |
Basic Info
| Investment Strategy | |
| The Fund seeks long-term growth and capital appreciation. It invests at least 80% of net assets in equity securities of medium-sized companies with significant capital appreciation potential. Medium-sized companies are those with market capitalizations in either the Russell Mid Cap Index or the S&P Mid Cap 400 Index. |
| General | |
| Security Type | Mutual Fund |
| Equity Style | Mid Cap Growth |
| Broad Asset Class | US Equity |
| Broad Category | Equity |
| Global Peer Group | Equity US Sm&Mid Cap |
| Peer Group | Mid-Cap Growth Funds |
| Global Macro | Equity North America |
| US Macro | Mid-Cap Funds |
| YCharts Categorization | -- |
| YCharts Benchmark | -- |
| Prospectus Objective | Mid-Cap Funds |
| Fund Owner Firm Name | John Hancock Group |
| Broad Asset Class Benchmark Index | |
| ^SPXTR | 100.0% |
Net Fund Flows Versus Peer Group
1 Month
% Rank:
73
-808.90M
Peer Group Low
279.30M
Peer Group High
1 Year
% Rank:
60
-175.05M
-6.247B
Peer Group Low
2.704B
Peer Group High
3 Months
% Rank:
69
-3.221B
Peer Group Low
1.055B
Peer Group High
3 Years
% Rank:
72
-14.78B
Peer Group Low
5.171B
Peer Group High
6 Months
% Rank:
62
-4.642B
Peer Group Low
1.617B
Peer Group High
5 Years
% Rank:
1
-19.45B
Peer Group Low
9.527B
Peer Group High
YTD
% Rank:
65
-3.848B
Peer Group Low
1.492B
Peer Group High
10 Years
% Rank:
1
-30.61B
Peer Group Low
9.527B
Peer Group High
Date Unavailable
Risk
Performance Versus Peer Group
Annual Total Returns Versus Peers
As of June 10, 2026.
Asset Allocation
As of March 31, 2026.
| Type | % Net |
|---|---|
| Cash | 0.74% |
| Stock | 98.18% |
| Bond | 0.60% |
| Convertible | 0.00% |
| Preferred | 0.26% |
| Other | 0.22% |
Top 10 Holdings
| Name | % Weight | Price | % Change |
|---|---|---|---|
| Vertiv Holdings Co. | 6.31% | 289.52 | -3.68% |
| Cloudflare, Inc. | 4.02% | 236.13 | -4.71% |
|
USD CASH
|
3.92% | -- | -- |
| Howmet Aerospace, Inc. | 3.68% | 257.16 | 4.30% |
| Natera, Inc. | 3.29% | 222.82 | 4.38% |
| Flex Ltd. | 3.16% | 147.21 | -2.40% |
| Corning, Inc. | 2.90% | 173.94 | -7.25% |
| Celestica, Inc. | 2.88% | 371.86 | -3.79% |
| Quanta Services, Inc. | 2.75% | 691.95 | -0.27% |
| Monolithic Power Systems, Inc. | 2.51% | 1531.98 | -1.74% |
Fees & Availability
| Fees | |
| Actual 12B-1 Fee | -- |
| Actual Management Fee | 0.75% |
| Administration Fee | -- |
| Maximum Front Load | -- |
| Maximum Deferred Load | -- |
| Maximum Redemption Fee | -- |
| General Availability | |
| Available for Insurance Product | No |
| Available for RRSP | No |
| Purchase Details | |
| Open to New Investors |
|
| Minimum Initial Investment | 1.00M None |
| Minimum Subsequent Investment | 0.00 None |
Basic Info
| Investment Strategy | |
| The Fund seeks long-term growth and capital appreciation. It invests at least 80% of net assets in equity securities of medium-sized companies with significant capital appreciation potential. Medium-sized companies are those with market capitalizations in either the Russell Mid Cap Index or the S&P Mid Cap 400 Index. |
| General | |
| Security Type | Mutual Fund |
| Equity Style | Mid Cap Growth |
| Broad Asset Class | US Equity |
| Broad Category | Equity |
| Global Peer Group | Equity US Sm&Mid Cap |
| Peer Group | Mid-Cap Growth Funds |
| Global Macro | Equity North America |
| US Macro | Mid-Cap Funds |
| YCharts Categorization | -- |
| YCharts Benchmark | -- |
| Prospectus Objective | Mid-Cap Funds |
| Fund Owner Firm Name | John Hancock Group |
| Broad Asset Class Benchmark Index | |
| ^SPXTR | 100.0% |
Fundamentals
| General | |
| Distribution Yield | -- |
| Dividend Yield TTM (6-8-26) | 0.00% |
| 30-Day SEC Yield | -- |
| 7-Day SEC Yield | -- |
| Number of Holdings | 67 |
| Stock | |
| Weighted Average PE Ratio | 42.93 |
| Weighted Average Price to Sales Ratio | 8.285 |
| Weighted Average Price to Book Ratio | 11.87 |
| Weighted Median ROE | 15.92% |
| Weighted Median ROA | 5.79% |
| ROI (TTM) | 8.33% |
| Return on Investment (TTM) | 8.33% |
| Earning Yield | 0.0270 |
| LT Debt / Shareholders Equity | 1.317 |
| Number of Equity Holdings | 62 |
As of March 31, 2026
Growth Metrics
| EPS Growth (1Y) | 36.55% |
| EPS Growth (3Y) | 27.11% |
| EPS Growth (5Y) | 27.44% |
| Sales Growth (1Y) | 20.88% |
| Sales Growth (3Y) | 22.70% |
| Sales Growth (5Y) | 26.19% |
| Sales per Share Growth (1Y) | 25.21% |
| Sales per Share Growth (3Y) | 18.30% |
| Operating Cash Flow - Growth Rate (3Y) | 38.94% |
As of March 31, 2026
Fund Details
Top Portfolio Holders
| Name | % Weight |
|---|---|
| Portfolio A | 5.00% |
| Portfolio B | 3.50% |
| Portfolio C | 2.25% |
Excel Add-In Codes
| Name: =YCI("M:JACEX", "name") |
| Broad Asset Class: =YCI("M:JACEX", "broad_asset_class") |
| Broad Category: =YCI("M:JACEX", "broad_category_group") |
| Prospectus Objective: =YCI("M:JACEX", "prospectus_objective") |
| To find the codes for any of our securities and financial metrics, see our Complete Excel Reference. |