

Nomura High Income Fund Inst (IVHIX)
5.75
-0.01
(-0.17%)
USD |
Jun 09 2026
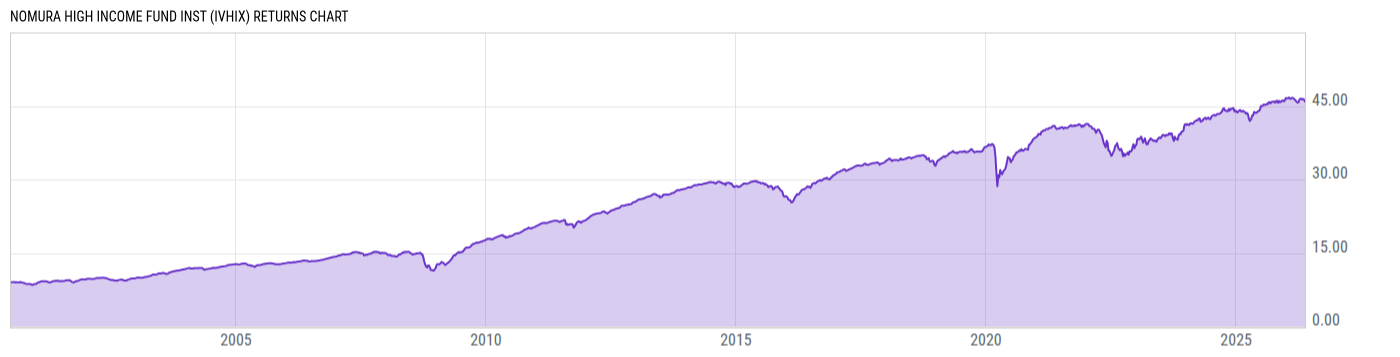
Returns Chart
Key Stats
| Net Expense Ratio | Total Assets Under Management | Weighted Average Dividend Yield | Turnover Ratio (Generic) |
|---|---|---|---|
| 0.63% | 1.667B | -- | 56.00% |
| 1 Year Fund Level Flows | 1 Year Total Returns (Daily) | Annualized Total Returns Since Inception (Daily) | Max Drawdown (Since Inception) |
| -742.05M | 5.27% |
Basic Info
| Investment Strategy | |
| The Fund seeks a high level a current income as its primary goal and capital growth as a secondary goal when consistent with its primary goal. The Fund invests in high-yield, high-risk, fixed-income securities of U.S. issuers and may invest up to 20% of its total assets in common stock in order to seek capital growth. |
| General | |
| Security Type | Mutual Fund |
| Equity Style | -- |
| Broad Asset Class | Taxable Bond |
| Broad Category | Fixed Income |
| Global Peer Group | Bond USD High Yield |
| Peer Group | High Yield Funds |
| Global Macro | Bond High Yield |
| US Macro | High Yield Funds |
| YCharts Categorization | -- |
| YCharts Benchmark | -- |
| Prospectus Objective | High Yield Funds |
| Fund Owner Firm Name | Nomura Asset Management |
| Broad Asset Class Benchmark Index | |
| ^BBUSATR | 100.0% |
Net Fund Flows Versus Peer Group
1 Month
% Rank:
93
-2.560B
Peer Group Low
510.03M
Peer Group High
1 Year
% Rank:
93
-742.05M
-2.841B
Peer Group Low
12.05B
Peer Group High
3 Months
% Rank:
94
-2.713B
Peer Group Low
900.82M
Peer Group High
3 Years
% Rank:
93
-4.326B
Peer Group Low
13.55B
Peer Group High
6 Months
% Rank:
94
-2.877B
Peer Group Low
1.301B
Peer Group High
5 Years
% Rank:
90
-9.174B
Peer Group Low
14.79B
Peer Group High
YTD
% Rank:
92
-4.190B
Peer Group Low
1.217B
Peer Group High
10 Years
% Rank:
98
-9.701B
Peer Group Low
21.92B
Peer Group High
Date Unavailable
Risk
Performance Versus Peer Group
Annual Total Returns Versus Peers
As of June 10, 2026.
Asset Allocation
As of March 31, 2026.
| Type | % Net |
|---|---|
| Cash | 2.25% |
| Stock | 0.86% |
| Bond | 96.89% |
| Convertible | 0.00% |
| Preferred | 0.00% |
| Other | 0.00% |
Top 10 Holdings
| Name | % Weight | Price | % Change |
|---|---|---|---|
|
Cash and Cash Equivalents
|
3.87% | -- | -- |
|
New Cotai LLC FRN 02-Feb-2027
|
1.37% | -- | -- |
| CCO Holdings, LLC CHTR-CCOH 7.0 02/01/2033 FIX USD Corporate 144A | 1.33% | 96.22 | 0.52% |
| Jones DesLauriers Insurance Management Inc. JONEDES 8.5 03/15/2030 FIX USD Corporate 144A | 1.26% | 101.90 | 0.04% |
| ILIAD HOLDING ILIADHO 8.5 04/15/2031 FIX USD Corporate 144A | 1.24% | 105.61 | -0.21% |
| WHITE CAP SUPPLY HOLDINGS, LLC WHITCAAD 7.375 11/15/2030 FIX USD Corporate 144A | 1.08% | 99.49 | 0.18% |
| Venture Global LNG, Inc. VENTUGL 9.875 02/01/2032 FIX USD Corporate 144A | 1.06% | 107.12 | 0.01% |
| Vistra Corp. VISTCOR 8.0 12/31/2099 FLT USD Corporate 144A '26 | 1.01% | 100.74 | -0.11% |
| Magnera Corporation MAGNERC 7.25 11/15/2031 FIX USD Corporate 144A | 1.01% | 96.78 | 0.67% |
| VICTRA HOLDINGS, LLC VICTRHO 8.75 09/15/2029 FIX USD Corporate 144A | 1.00% | 103.19 | -0.06% |
Fees & Availability
| Fees | |
| Actual 12B-1 Fee | -- |
| Actual Management Fee | 0.47% |
| Administration Fee | -- |
| Maximum Front Load | -- |
| Maximum Deferred Load | -- |
| Maximum Redemption Fee | 0.00% |
| General Availability | |
| Available for Insurance Product | No |
| Available for RRSP | No |
| Purchase Details | |
| Open to New Investors |
|
| Minimum Initial Investment | 0.00 None |
| Minimum Subsequent Investment | 0.00 None |
Basic Info
| Investment Strategy | |
| The Fund seeks a high level a current income as its primary goal and capital growth as a secondary goal when consistent with its primary goal. The Fund invests in high-yield, high-risk, fixed-income securities of U.S. issuers and may invest up to 20% of its total assets in common stock in order to seek capital growth. |
| General | |
| Security Type | Mutual Fund |
| Equity Style | -- |
| Broad Asset Class | Taxable Bond |
| Broad Category | Fixed Income |
| Global Peer Group | Bond USD High Yield |
| Peer Group | High Yield Funds |
| Global Macro | Bond High Yield |
| US Macro | High Yield Funds |
| YCharts Categorization | -- |
| YCharts Benchmark | -- |
| Prospectus Objective | High Yield Funds |
| Fund Owner Firm Name | Nomura Asset Management |
| Broad Asset Class Benchmark Index | |
| ^BBUSATR | 100.0% |
Fundamentals
| General | |
| Distribution Yield | -- |
| Dividend Yield TTM (6-8-26) | 6.73% |
| 30-Day SEC Yield (12-31-21) | 5.56% |
| 7-Day SEC Yield | -- |
| Number of Holdings | 241 |
| Bond | |
| Yield to Maturity (3-31-26) | 7.84% |
| Effective Duration | 2.72 |
| Average Coupon | 7.87% |
| Calculated Average Quality | 5.774 |
| Effective Maturity | 6.494 |
| Nominal Maturity | 6.521 |
| Number of Bond Holdings | 225 |
As of March 31, 2026
Fund Details
| Key Dates | |
| Inception Date | 7/3/2000 |
| Last Annual Report Date | 3/31/2025 |
| Last Prospectus Date | 7/31/2025 |
| Share Classes | |
| IHIFX | Retirement |
| IYHIX | Retirement |
| WHIAX | A |
| WHIYX | Inst |
| WRHIX | C |
| Attributes | |
| Index Fund | -- |
| Inverse Fund | No |
| Leveraged Fund | -- |
| Fund of Funds | No |
| Currency Hedged Fund | -- |
| Socially Responsible Fund | No |
Top Portfolio Holders
| Name | % Weight |
|---|---|
| Portfolio A | 5.00% |
| Portfolio B | 3.50% |
| Portfolio C | 2.25% |
Excel Add-In Codes
| Name: =YCI("M:IVHIX", "name") |
| Broad Asset Class: =YCI("M:IVHIX", "broad_asset_class") |
| Broad Category: =YCI("M:IVHIX", "broad_category_group") |
| Prospectus Objective: =YCI("M:IVHIX", "prospectus_objective") |
| To find the codes for any of our securities and financial metrics, see our Complete Excel Reference. |