

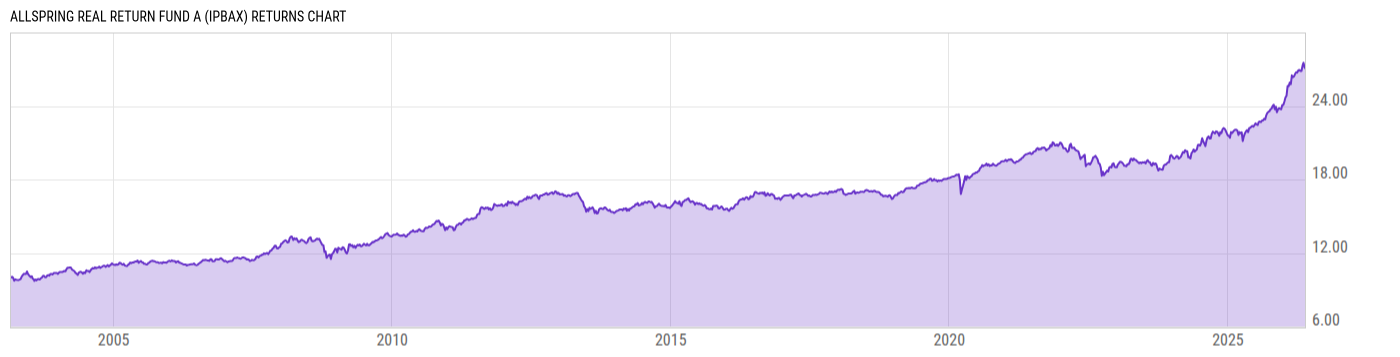
Allspring Real Return Fund A (IPBAX)
12.42
+0.01
(+0.08%)
USD |
May 21 2026
Returns Chart
Key Stats
| Net Expense Ratio | Total Assets Under Management | Weighted Average Dividend Yield | Turnover Ratio (Generic) |
|---|---|---|---|
| 0.77% | 229.25M | -- | 61.00% |
| 1 Year Fund Level Flows | 1 Year Total Returns (Daily) | Annualized Total Returns Since Inception (Daily) | Max Drawdown (Since Inception) |
| 77.94M | 22.85% |
Basic Info
| Investment Strategy | |
| The Fund seeks to invest principally in inflation-protected debt securities including those issued by the U.S. Treasury and agencies and instrumentalities of the U.S. Government other than the U.S. Treasury. Under normal circumstances, we expect to maintain a dollar-weighted average maturity between 5 and 20 years. |
| General | |
| Security Type | Mutual Fund |
| Equity Style | -- |
| Broad Asset Class | Allocation |
| Broad Category | Allocation |
| Global Peer Group | Mixed Asset USD Flexible - US |
| Peer Group | Real Return Funds |
| Global Macro | Mixed Asset HC Flexible |
| US Macro | Mixed-Assets Funds |
| YCharts Categorization | -- |
| YCharts Benchmark | -- |
| Prospectus Objective | Real Return Funds |
| Fund Owner Firm Name | Allspring |
| Broad Asset Class Benchmark Index | |
| ^SPXTR | 100.0% |
Net Fund Flows Versus Peer Group
1 Month
% Rank:
30
-150.24M
Peer Group Low
167.03M
Peer Group High
1 Year
% Rank:
12
77.94M
-3.392B
Peer Group Low
675.56M
Peer Group High
3 Months
% Rank:
16
-1.092B
Peer Group Low
473.36M
Peer Group High
3 Years
% Rank:
19
-2.135B
Peer Group Low
648.85M
Peer Group High
6 Months
% Rank:
14
-2.547B
Peer Group Low
605.21M
Peer Group High
5 Years
% Rank:
41
-2.782B
Peer Group Low
1.853B
Peer Group High
YTD
% Rank:
16
-1.472B
Peer Group Low
559.85M
Peer Group High
10 Years
% Rank:
28
-2.877B
Peer Group Low
3.052B
Peer Group High
Date Unavailable
Risk
Performance Versus Peer Group
Annual Total Returns Versus Peers
As of May 22, 2026.
Asset Allocation
As of February 28, 2026.
| Type | % Net |
|---|---|
| Cash | 16.94% |
| Stock | 31.37% |
| Bond | 35.37% |
| Convertible | 0.00% |
| Preferred | 0.66% |
| Other | 15.66% |
Top 10 Holdings
| Name | % Weight | Price | % Change |
|---|---|---|---|
| Allspring Govt Money Market Fund Sel | 25.42% | 1.00 | 0.00% |
|
5YR T NOTE JUN26
|
25.21% | -- | -- |
|
LONG GILT JUN6
|
16.24% | -- | -- |
|
Real Return Special Investments (Cayman) Ltd
|
13.55% | -- | -- |
|
BUND FUT 6% MAR6
|
7.10% | -- | -- |
|
CA 10YR BND JUN6
|
7.04% | -- | -- |
|
MSCI EMERG MAR6
|
5.78% | -- | -- |
| iShares MSCI South Korea ETF | 4.51% | 185.61 | -0.43% |
|
OMXS30 MAR6
|
3.38% | -- | -- |
|
10YR TB-DAY MAR6
|
3.14% | -- | -- |
Fees & Availability
| Fees | |
| Actual 12B-1 Fee | -- |
| Actual Management Fee | 0.13% |
| Administration Fee | 20.42K% |
| Maximum Front Load | 4.50% |
| Maximum Deferred Load | -- |
| Maximum Redemption Fee | -- |
| General Availability | |
| Available for Insurance Product | No |
| Available for RRSP | No |
| Purchase Details | |
| Open to New Investors |
|
| Minimum Initial Investment | 1000.00 None |
| Minimum Subsequent Investment | 100.00 None |
Basic Info
| Investment Strategy | |
| The Fund seeks to invest principally in inflation-protected debt securities including those issued by the U.S. Treasury and agencies and instrumentalities of the U.S. Government other than the U.S. Treasury. Under normal circumstances, we expect to maintain a dollar-weighted average maturity between 5 and 20 years. |
| General | |
| Security Type | Mutual Fund |
| Equity Style | -- |
| Broad Asset Class | Allocation |
| Broad Category | Allocation |
| Global Peer Group | Mixed Asset USD Flexible - US |
| Peer Group | Real Return Funds |
| Global Macro | Mixed Asset HC Flexible |
| US Macro | Mixed-Assets Funds |
| YCharts Categorization | -- |
| YCharts Benchmark | -- |
| Prospectus Objective | Real Return Funds |
| Fund Owner Firm Name | Allspring |
| Broad Asset Class Benchmark Index | |
| ^SPXTR | 100.0% |
Fundamentals
| General | |
| Distribution Yield | -- |
| Dividend Yield TTM (5-20-26) | 2.31% |
| 30-Day SEC Yield (4-30-26) | 2.11% |
| 7-Day SEC Yield | -- |
| Number of Holdings | 381 |
| Stock | |
| Weighted Average PE Ratio | 30.45 |
| Weighted Average Price to Sales Ratio | 7.737 |
| Weighted Average Price to Book Ratio | 7.051 |
| Weighted Median ROE | 25.62% |
| Weighted Median ROA | 11.73% |
| ROI (TTM) | 17.63% |
| Return on Investment (TTM) | 17.63% |
| Earning Yield | 0.0438 |
| LT Debt / Shareholders Equity | 0.6783 |
| Number of Equity Holdings | 136 |
| Bond | |
| Yield to Maturity (2-28-26) | 2.58% |
| Effective Duration | 4.83 |
| Average Coupon | 2.35% |
| Calculated Average Quality | 2.905 |
| Effective Maturity | 5.705 |
| Nominal Maturity | 6.407 |
| Number of Bond Holdings | 191 |
As of February 28, 2026
Growth Metrics
| EPS Growth (1Y) | 31.02% |
| EPS Growth (3Y) | 21.32% |
| EPS Growth (5Y) | 21.98% |
| Sales Growth (1Y) | 17.63% |
| Sales Growth (3Y) | 14.18% |
| Sales Growth (5Y) | 16.25% |
| Sales per Share Growth (1Y) | 17.45% |
| Sales per Share Growth (3Y) | 13.82% |
| Operating Cash Flow - Growth Rate (3Y) | 30.56% |
As of February 28, 2026
Top Portfolio Holders
| Name | % Weight |
|---|---|
| Portfolio A | 5.00% |
| Portfolio B | 3.50% |
| Portfolio C | 2.25% |
Excel Add-In Codes
| Name: =YCI("M:IPBAX", "name") |
| Broad Asset Class: =YCI("M:IPBAX", "broad_asset_class") |
| Broad Category: =YCI("M:IPBAX", "broad_category_group") |
| Prospectus Objective: =YCI("M:IPBAX", "prospectus_objective") |
| To find the codes for any of our securities and financial metrics, see our Complete Excel Reference. |