

Voya Index Solution 2055 Portfolio I (IISNX)
23.98
-0.01
(-0.04%)
USD |
Jun 09 2026
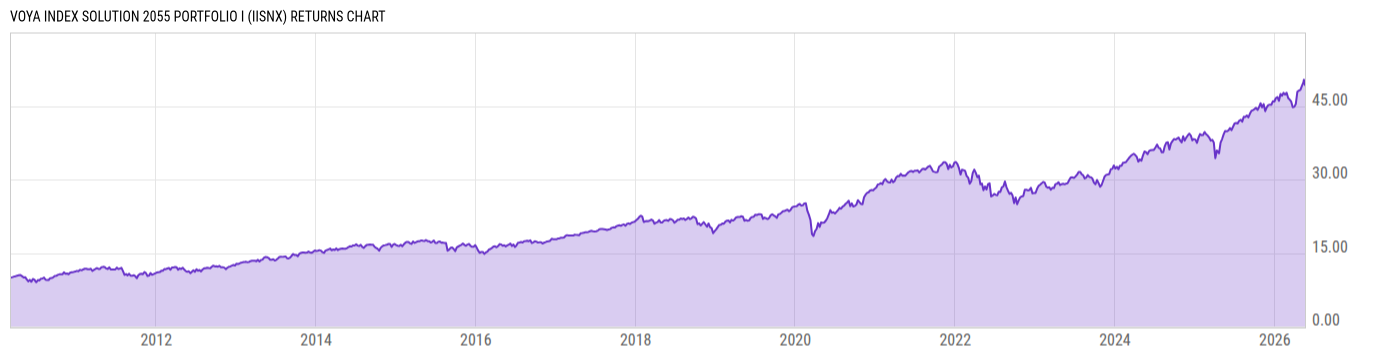
Returns Chart
Key Stats
| Net Expense Ratio | Total Assets Under Management | Weighted Average Dividend Yield | Turnover Ratio (Generic) |
|---|---|---|---|
| 0.26% | 1.084B | -- | 25.00% |
| 1 Year Fund Level Flows | 1 Year Total Returns (Daily) | Annualized Total Returns Since Inception (Daily) | Max Drawdown (Since Inception) |
| -38.53M | 23.53% |
Basic Info
| Investment Strategy | |
| The Fund seeks to provide total return consistent with an asset allocation targeted at retirement in approximately 2055. The Fund invests in U.S. stocks, international stocks, U.S. bonds and other fixed income investments using asset allocation strategies designed for investors expecting to retire in 2055. |
| General | |
| Security Type | Insurance Fund |
| Equity Style | -- |
| Broad Asset Class | Allocation |
| Broad Category | Allocation |
| Global Peer Group | Target Maturity MA USD 2055 |
| Peer Group | Mixed-Asset Target 2055 Funds |
| Global Macro | Target Maturity |
| US Macro | Mixed-Assets Target Date Funds |
| YCharts Categorization | -- |
| YCharts Benchmark | -- |
| Prospectus Objective | Growth Funds |
| Fund Owner Firm Name | Voya |
| Broad Asset Class Benchmark Index | |
| ^SPXTR | 100.0% |
Net Fund Flows Versus Peer Group
1 Month
% Rank:
69
-273.03M
Peer Group Low
304.13M
Peer Group High
1 Year
% Rank:
69
-38.53M
-1.046B
Peer Group Low
3.783B
Peer Group High
3 Months
% Rank:
66
-456.86M
Peer Group Low
1.100B
Peer Group High
3 Years
% Rank:
77
-976.74M
Peer Group Low
11.76B
Peer Group High
6 Months
% Rank:
69
-617.43M
Peer Group Low
2.312B
Peer Group High
5 Years
% Rank:
42
-1.359B
Peer Group Low
14.50B
Peer Group High
YTD
% Rank:
66
-548.21M
Peer Group Low
2.245B
Peer Group High
10 Years
% Rank:
32
-1.793B
Peer Group Low
19.13B
Peer Group High
Date Unavailable
Risk
Performance Versus Peer Group
Annual Total Returns Versus Peers
As of June 10, 2026.
Asset Allocation
As of March 31, 2026.
| Type | % Net |
|---|---|
| Cash | -1.16% |
| Stock | 94.04% |
| Bond | 4.27% |
| Convertible | 0.00% |
| Preferred | 0.25% |
| Other | 2.60% |
Top 10 Holdings
| Name | % Weight | Price | % Change |
|---|---|---|---|
| Voya VACS Index Series S Portfolio | 53.90% | 17.66 | -0.28% |
| Voya VACS Index Series I Portfolio | 27.16% | 14.57 | 0.00% |
| Voya VACS Index Series EM Portfolio | 7.93% | 17.31 | 0.87% |
| Voya VACS Index Series MC Portfolio | 4.50% | 13.46 | 0.67% |
| Voya VACS Index Series SC Portfolio | 2.99% | 12.55 | 0.40% |
|
5YR T NOTE JUN26
|
2.47% | -- | -- |
| WisdomTree Voya Yield Enhanced USD Unvrsl Bd Fund | 1.98% | 48.24 | 0.18% |
| Vanguard Long-Term Treasury Index Fund ETF | 0.98% | 54.48 | 0.16% |
| Voya Russell Large Cap Growth Index Portfolio I | 0.49% | 74.70 | -0.85% |
|
Bank Of New York Cash Reserve
|
0.05% | -- | -- |
Fees & Availability
| Fees | |
| Actual 12B-1 Fee | -- |
| Actual Management Fee | -- |
| Administration Fee | -- |
| Maximum Front Load | -- |
| Maximum Deferred Load | -- |
| Maximum Redemption Fee | -- |
| General Availability | |
| Available for Insurance Product |
|
| Available for RRSP | No |
| Purchase Details | |
| Open to New Investors |
|
| Minimum Initial Investment | 0.00 None |
| Minimum Subsequent Investment | 0.00 None |
Basic Info
| Investment Strategy | |
| The Fund seeks to provide total return consistent with an asset allocation targeted at retirement in approximately 2055. The Fund invests in U.S. stocks, international stocks, U.S. bonds and other fixed income investments using asset allocation strategies designed for investors expecting to retire in 2055. |
| General | |
| Security Type | Insurance Fund |
| Equity Style | -- |
| Broad Asset Class | Allocation |
| Broad Category | Allocation |
| Global Peer Group | Target Maturity MA USD 2055 |
| Peer Group | Mixed-Asset Target 2055 Funds |
| Global Macro | Target Maturity |
| US Macro | Mixed-Assets Target Date Funds |
| YCharts Categorization | -- |
| YCharts Benchmark | -- |
| Prospectus Objective | Growth Funds |
| Fund Owner Firm Name | Voya |
| Broad Asset Class Benchmark Index | |
| ^SPXTR | 100.0% |
Fundamentals
| General | |
| Distribution Yield | -- |
| Dividend Yield TTM (6-8-26) | 1.51% |
| 30-Day SEC Yield | -- |
| 7-Day SEC Yield | -- |
| Number of Holdings | 13 |
| Stock | |
| Weighted Average PE Ratio | 27.95 |
| Weighted Average Price to Sales Ratio | 6.218 |
| Weighted Average Price to Book Ratio | 8.111 |
| Weighted Median ROE | 71.59% |
| Weighted Median ROA | 12.77% |
| ROI (TTM) | 19.08% |
| Return on Investment (TTM) | 19.08% |
| Earning Yield | 0.0474 |
| LT Debt / Shareholders Equity | 0.7401 |
| Number of Equity Holdings | 0 |
As of March 31, 2026
Growth Metrics
| EPS Growth (1Y) | 22.06% |
| EPS Growth (3Y) | 16.45% |
| EPS Growth (5Y) | 22.15% |
| Sales Growth (1Y) | 12.44% |
| Sales Growth (3Y) | 12.10% |
| Sales Growth (5Y) | 13.68% |
| Sales per Share Growth (1Y) | 26.08% |
| Sales per Share Growth (3Y) | 12.76% |
| Operating Cash Flow - Growth Rate (3Y) | 20.95% |
As of March 31, 2026
Fund Details
Top Portfolio Holders
| Name | % Weight |
|---|---|
| Portfolio A | 5.00% |
| Portfolio B | 3.50% |
| Portfolio C | 2.25% |