

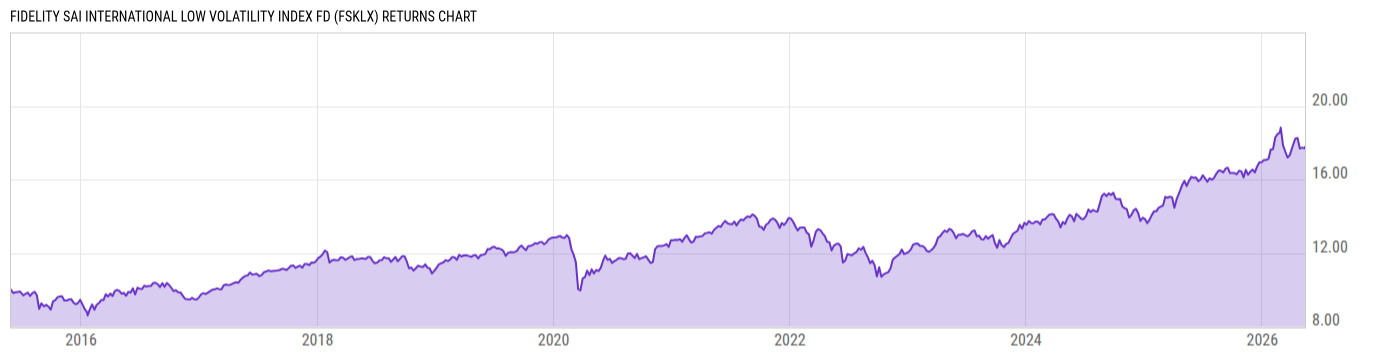
Fidelity SAI International Low Volatility Index Fd (FSKLX)
13.39
-0.05
(-0.37%)
USD |
Jun 02 2026
Returns Chart
Key Stats
| Net Expense Ratio | Total Assets Under Management | Weighted Average Dividend Yield | Turnover Ratio (Generic) |
|---|---|---|---|
| 0.16% | 7.352B | 2.94% | 23.00% |
| 1 Year Fund Level Flows | 1 Year Total Returns (Daily) | Annualized Total Returns Since Inception (Daily) | Max Drawdown (Since Inception) |
| 1.192B | 7.96% |
Basic Info
| Investment Strategy | |
| The Fund seeks to provide investment results that correspond to the total return of low volatility foreign stocks. It invests at least 80% of assets in common stocks included in the MSCI ACWI ex USA Minimum Volatility Index, which reflects the performance of a broad range of stocks across developed and emerging markets. |
| General | |
| Security Type | Mutual Fund |
| Equity Style | Multi Cap Core |
| Broad Asset Class | International Equity |
| Broad Category | Equity |
| Global Peer Group | Equity Global ex US |
| Peer Group | International Multi-Cap Core |
| Global Macro | Equity Global |
| US Macro | Developed International Markets Funds |
| YCharts Categorization | -- |
| YCharts Benchmark | -- |
| Prospectus Objective | International Funds |
| Fund Owner Firm Name | Fidelity Investments |
| Broad Asset Class Benchmark Index | |
| ^MSACXUSNTR | 100.0% |
Net Fund Flows Versus Peer Group
1 Month
% Rank:
8
-161.60M
Peer Group Low
2.669B
Peer Group High
1 Year
% Rank:
11
1.192B
-2.585B
Peer Group Low
21.73B
Peer Group High
3 Months
% Rank:
11
-549.38M
Peer Group Low
4.345B
Peer Group High
3 Years
% Rank:
66
-7.696B
Peer Group Low
39.36B
Peer Group High
6 Months
% Rank:
11
-1.564B
Peer Group Low
11.69B
Peer Group High
5 Years
% Rank:
23
-14.83B
Peer Group Low
62.56B
Peer Group High
YTD
% Rank:
12
-998.46M
Peer Group Low
7.616B
Peer Group High
10 Years
% Rank:
12
-43.26B
Peer Group Low
118.32B
Peer Group High
Date Unavailable
Risk
Performance Versus Peer Group
Annual Total Returns Versus Peers
As of June 03, 2026.
Asset Allocation
As of March 31, 2026.
| Type | % Net |
|---|---|
| Cash | 0.30% |
| Stock | 98.17% |
| Bond | 0.49% |
| Convertible | 0.00% |
| Preferred | 0.00% |
| Other | 1.04% |
Top 10 Holdings
| Name | % Weight | Price | % Change |
|---|---|---|---|
| Shell Plc | 2.29% | 43.72 | 1.04% |
| RELX Plc | 2.09% | 33.60 | -2.47% |
|
MSCI EAFE JUN6
|
2.04% | -- | -- |
| Tokio Marine Holdings, Inc. | 2.01% | 41.75 | -8.22% |
| AstraZeneca PLC | 1.99% | 176.32 | -0.64% |
| Novartis AG | 1.91% | 144.14 | -0.25% |
| National Grid Plc | 1.90% | 16.13 | -0.42% |
| Air Liquide SA | 1.88% | 205.05 | -1.48% |
| Zurich Insurance Group AG | 1.83% | 696.25 | 0.00% |
| GSK Plc | 1.82% | 23.94 | -1.29% |
Fees & Availability
| Fees | |
| Actual 12B-1 Fee | -- |
| Actual Management Fee | 0.15% |
| Administration Fee | -- |
| Maximum Front Load | -- |
| Maximum Deferred Load | -- |
| Maximum Redemption Fee | -- |
| General Availability | |
| Available for Insurance Product | No |
| Available for RRSP | No |
| Purchase Details | |
| Open to New Investors |
|
| Minimum Initial Investment | 0.00 None |
| Minimum Subsequent Investment | 0.00 None |
Basic Info
| Investment Strategy | |
| The Fund seeks to provide investment results that correspond to the total return of low volatility foreign stocks. It invests at least 80% of assets in common stocks included in the MSCI ACWI ex USA Minimum Volatility Index, which reflects the performance of a broad range of stocks across developed and emerging markets. |
| General | |
| Security Type | Mutual Fund |
| Equity Style | Multi Cap Core |
| Broad Asset Class | International Equity |
| Broad Category | Equity |
| Global Peer Group | Equity Global ex US |
| Peer Group | International Multi-Cap Core |
| Global Macro | Equity Global |
| US Macro | Developed International Markets Funds |
| YCharts Categorization | -- |
| YCharts Benchmark | -- |
| Prospectus Objective | International Funds |
| Fund Owner Firm Name | Fidelity Investments |
| Broad Asset Class Benchmark Index | |
| ^MSACXUSNTR | 100.0% |
Fundamentals
| General | |
| Distribution Yield | -- |
| Dividend Yield TTM (6-1-26) | 2.49% |
| 30-Day SEC Yield (10-3-23) | 0.00% |
| 7-Day SEC Yield (10-3-23) | 0.00% |
| Number of Holdings | 142 |
| Stock | |
| Weighted Average PE Ratio | 20.79 |
| Weighted Average Price to Sales Ratio | 3.721 |
| Weighted Average Price to Book Ratio | 3.936 |
| Weighted Median ROE | 18.86% |
| Weighted Median ROA | 5.52% |
| ROI (TTM) | 10.28% |
| Return on Investment (TTM) | 10.28% |
| Earning Yield | 0.0569 |
| LT Debt / Shareholders Equity | 0.7470 |
| Number of Equity Holdings | 134 |
As of March 31, 2026
Growth Metrics
| EPS Growth (1Y) | 18.55% |
| EPS Growth (3Y) | 10.71% |
| EPS Growth (5Y) | 8.99% |
| Sales Growth (1Y) | 3.13% |
| Sales Growth (3Y) | 4.71% |
| Sales Growth (5Y) | 4.85% |
| Sales per Share Growth (1Y) | 3.61% |
| Sales per Share Growth (3Y) | 4.72% |
| Operating Cash Flow - Growth Rate (3Y) | 9.67% |
As of March 31, 2026
Fund Details
| Key Dates | |
| Inception Date | 5/29/2015 |
| Last Annual Report Date | 10/31/2025 |
| Last Prospectus Date | 12/30/2025 |
| Attributes | |
| Index Fund |
|
| Inverse Fund | No |
| Leveraged Fund | -- |
| Fund of Funds | No |
| Currency Hedged Fund | -- |
| Socially Responsible Fund | No |
Top Portfolio Holders
| Name | % Weight |
|---|---|
| Portfolio A | 5.00% |
| Portfolio B | 3.50% |
| Portfolio C | 2.25% |
Excel Add-In Codes
| Name: =YCI("M:FSKLX", "name") |
| Broad Asset Class: =YCI("M:FSKLX", "broad_asset_class") |
| Broad Category: =YCI("M:FSKLX", "broad_category_group") |
| Prospectus Objective: =YCI("M:FSKLX", "prospectus_objective") |
| To find the codes for any of our securities and financial metrics, see our Complete Excel Reference. |