

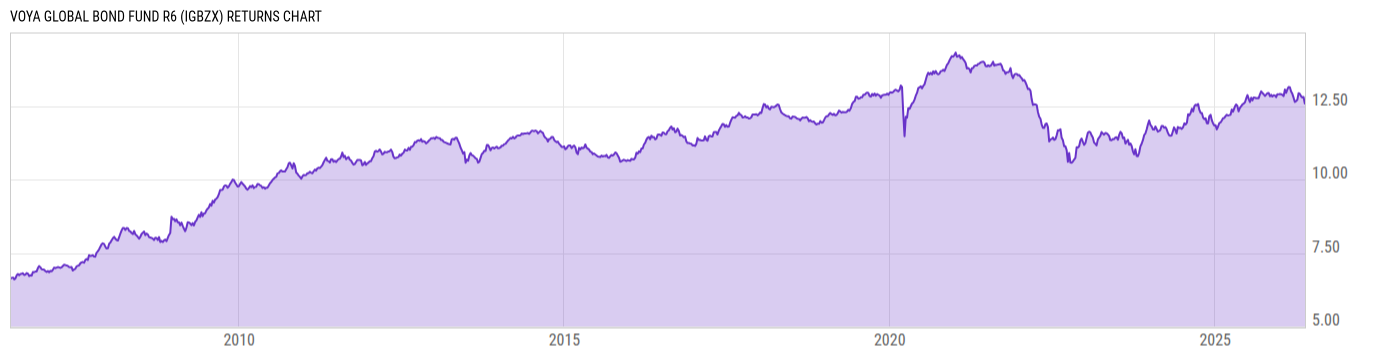
Voya Global Bond Fund R6 (IGBZX)
7.06
+0.02
(+0.28%)
USD |
Jun 09 2026
Returns Chart
Key Stats
| Net Expense Ratio | Total Assets Under Management | Weighted Average Dividend Yield | Turnover Ratio (Generic) |
|---|---|---|---|
| 0.65% | 78.74M | -- | 128.0% |
| 1 Year Fund Level Flows | 1 Year Total Returns (Daily) | Annualized Total Returns Since Inception (Daily) | Max Drawdown (Since Inception) |
| -56.76M | 1.12% |
Basic Info
| Investment Strategy | |
| The Fund seeks to maximize total return through a combination of current income and capital appreciation. Under normal market conditions, the Fund will invest at least 80% of its assets in a portfolio of fixed-income securities of issuers in a number of different countries, which may include the U.S. |
| General | |
| Security Type | Mutual Fund |
| Equity Style | -- |
| Broad Asset Class | Taxable Bond |
| Broad Category | Fixed Income |
| Global Peer Group | Bond Global USD |
| Peer Group | Global Income Funds |
| Global Macro | Bond Global |
| US Macro | World Income Funds |
| YCharts Categorization | -- |
| YCharts Benchmark | -- |
| Prospectus Objective | Global Income Funds |
| Fund Owner Firm Name | Voya |
| Broad Asset Class Benchmark Index | |
| ^BBUSATR | 100.0% |
Net Fund Flows Versus Peer Group
1 Month
% Rank:
68
-35.14M
Peer Group Low
294.12M
Peer Group High
1 Year
% Rank:
72
-56.76M
-1.119B
Peer Group Low
1.537B
Peer Group High
3 Months
% Rank:
53
-325.40M
Peer Group Low
571.67M
Peer Group High
3 Years
% Rank:
72
-2.484B
Peer Group Low
2.741B
Peer Group High
6 Months
% Rank:
88
-731.75M
Peer Group Low
783.93M
Peer Group High
5 Years
% Rank:
67
-7.808B
Peer Group Low
3.313B
Peer Group High
YTD
% Rank:
92
-469.47M
Peer Group Low
717.27M
Peer Group High
10 Years
% Rank:
70
-47.03B
Peer Group Low
4.548B
Peer Group High
Date Unavailable
Risk
Performance Versus Peer Group
Annual Total Returns Versus Peers
As of June 10, 2026.
Asset Allocation
As of April 30, 2026.
| Type | % Net |
|---|---|
| Cash | -30.28% |
| Stock | 0.00% |
| Bond | 87.28% |
| Convertible | 0.00% |
| Preferred | 0.00% |
| Other | 43.01% |
Top 10 Holdings
| Name | % Weight | Price | % Change |
|---|---|---|---|
|
2YR T-NOTE JUN26
|
8.75% | -- | -- |
|
FOAT JUN6
|
8.18% | -- | -- |
|
BOBL FUT 6% JUN6
|
6.57% | -- | -- |
|
SCHATZ 6% JUN6
|
5.09% | -- | -- |
|
10Y TNotes JUN26
|
4.81% | -- | -- |
|
BTP 6% JUN6
|
4.61% | -- | -- |
|
CA 10YR BND JUN6
|
2.62% | -- | -- |
|
ULTRA BOND JUN26
|
2.57% | -- | -- |
| Morgan Stanley Inst Liq Govt Port Institutional | 2.36% | 1.00 | 0.00% |
|
Federal National Mortgage Association 2% 01-MAY-2056
|
2.34% | -- | -- |
Fees & Availability
| Fees | |
| Actual 12B-1 Fee | -- |
| Actual Management Fee | 0.46% |
| Administration Fee | -- |
| Maximum Front Load | -- |
| Maximum Deferred Load | -- |
| Maximum Redemption Fee | -- |
| General Availability | |
| Available for Insurance Product | No |
| Available for RRSP | No |
| Purchase Details | |
| Open to New Investors |
|
| Minimum Initial Investment | 1.00M None |
| Minimum Subsequent Investment | 0.00 None |
Basic Info
| Investment Strategy | |
| The Fund seeks to maximize total return through a combination of current income and capital appreciation. Under normal market conditions, the Fund will invest at least 80% of its assets in a portfolio of fixed-income securities of issuers in a number of different countries, which may include the U.S. |
| General | |
| Security Type | Mutual Fund |
| Equity Style | -- |
| Broad Asset Class | Taxable Bond |
| Broad Category | Fixed Income |
| Global Peer Group | Bond Global USD |
| Peer Group | Global Income Funds |
| Global Macro | Bond Global |
| US Macro | World Income Funds |
| YCharts Categorization | -- |
| YCharts Benchmark | -- |
| Prospectus Objective | Global Income Funds |
| Fund Owner Firm Name | Voya |
| Broad Asset Class Benchmark Index | |
| ^BBUSATR | 100.0% |
Fundamentals
| General | |
| Distribution Yield | -- |
| Dividend Yield TTM (6-8-26) | 4.76% |
| 30-Day SEC Yield (5-31-26) | 4.51% |
| 7-Day SEC Yield (1-31-20) | 2.29% |
| Number of Holdings | 949 |
Fund Details
Top Portfolio Holders
| Name | % Weight |
|---|---|
| Portfolio A | 5.00% |
| Portfolio B | 3.50% |
| Portfolio C | 2.25% |
Excel Add-In Codes
| Name: =YCI("M:IGBZX", "name") |
| Broad Asset Class: =YCI("M:IGBZX", "broad_asset_class") |
| Broad Category: =YCI("M:IGBZX", "broad_category_group") |
| Prospectus Objective: =YCI("M:IGBZX", "prospectus_objective") |
| To find the codes for any of our securities and financial metrics, see our Complete Excel Reference. |