

Nomura Climate Solutions Fund Y (IEYYX)
13.30
0.00 (0.00%)
USD |
May 29 2026
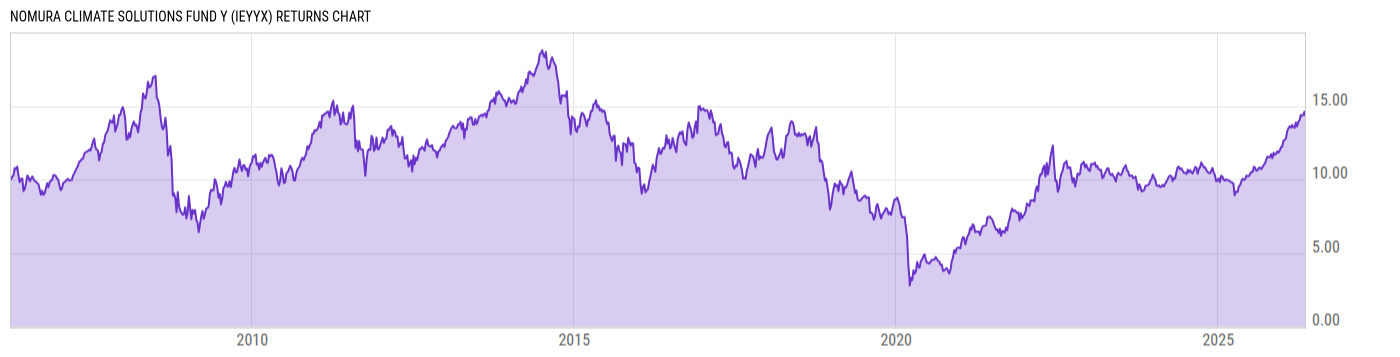
Returns Chart
Key Stats
| Net Expense Ratio | Total Assets Under Management | Weighted Average Dividend Yield | Turnover Ratio (Generic) |
|---|---|---|---|
| 1.24% | 115.27M | 1.72% | 20.00% |
| 1 Year Fund Level Flows | 1 Year Total Returns (Daily) | Annualized Total Returns Since Inception (Daily) | Max Drawdown (Since Inception) |
| -20.88M | 47.77% |
Basic Info
| Investment Strategy | |
| The Fund seeks to provide capital growth. It will invest at least 80% of its net assets, plus the amount of any borrowings for investment purposes, in securities of companies that the Manager has identified as being capable of reducing, displacing and/or sequestering greenhouse gas emissions or helping others to do so. |
| General | |
| Security Type | Mutual Fund |
| Equity Style | Multi Cap Value |
| Broad Asset Class | Sector Equity |
| Broad Category | Equity |
| Global Peer Group | Equity Other |
| Peer Group | Specialty/Miscellaneous Funds |
| Global Macro | Equity Other |
| US Macro | Sector Equity Funds |
| YCharts Categorization | -- |
| YCharts Benchmark | -- |
| Prospectus Objective | Specialty/Miscellaneous Funds |
| Fund Owner Firm Name | Nomura Asset Management |
| Broad Asset Class Benchmark Index | |
| ^MSWNTR | 100.0% |
Net Fund Flows Versus Peer Group
1 Month
% Rank:
60
-175.38M
Peer Group Low
53.45M
Peer Group High
1 Year
% Rank:
74
-20.88M
-644.05M
Peer Group Low
462.79M
Peer Group High
3 Months
% Rank:
65
-281.40M
Peer Group Low
88.74M
Peer Group High
3 Years
% Rank:
78
-1.091B
Peer Group Low
942.75M
Peer Group High
6 Months
% Rank:
72
-380.60M
Peer Group Low
227.07M
Peer Group High
5 Years
% Rank:
90
-1.231B
Peer Group Low
1.848B
Peer Group High
YTD
% Rank:
72
-331.45M
Peer Group Low
213.28M
Peer Group High
10 Years
% Rank:
96
-2.833B
Peer Group Low
2.969B
Peer Group High
Date Unavailable
Risk
Performance Versus Peer Group
Annual Total Returns Versus Peers
As of May 31, 2026.
Asset Allocation
As of March 31, 2026.
| Type | % Net |
|---|---|
| Cash | 0.29% |
| Stock | 99.57% |
| Bond | 0.14% |
| Convertible | 0.00% |
| Preferred | 0.00% |
| Other | 0.00% |
Top 10 Holdings
| Name | % Weight | Price | % Change |
|---|---|---|---|
| Darling Ingredients, Inc. | 4.08% | 59.10 | -0.87% |
| Neste Corp. | 4.03% | 32.88 | -0.35% |
| Valero Energy Corp. | 3.78% | 244.82 | -0.01% |
| Ameren Corp. | 3.78% | 107.97 | -0.88% |
| EDP Renewables SA | 3.64% | 16.96 | 0.00% |
| Contemporary Amperex Technology Co., Ltd. | 3.63% | 95.40 | 3.57% |
| CMS Energy Corp. | 3.62% | 72.57 | -0.82% |
| NiSource, Inc. | 3.56% | 46.22 | -1.18% |
| Xcel Energy, Inc. | 3.55% | 79.50 | 0.30% |
| NextEra Energy, Inc. | 3.51% | 87.01 | -0.28% |
Fees & Availability
| Fees | |
| Actual 12B-1 Fee | 0.25% |
| Actual Management Fee | 0.59% |
| Administration Fee | -- |
| Maximum Front Load | -- |
| Maximum Deferred Load | -- |
| Maximum Redemption Fee | 0.00% |
| General Availability | |
| Available for Insurance Product | No |
| Available for RRSP | No |
| Purchase Details | |
| Open to New Investors |
|
| Minimum Initial Investment | 0.00 None |
| Minimum Subsequent Investment | 0.00 None |
Basic Info
| Investment Strategy | |
| The Fund seeks to provide capital growth. It will invest at least 80% of its net assets, plus the amount of any borrowings for investment purposes, in securities of companies that the Manager has identified as being capable of reducing, displacing and/or sequestering greenhouse gas emissions or helping others to do so. |
| General | |
| Security Type | Mutual Fund |
| Equity Style | Multi Cap Value |
| Broad Asset Class | Sector Equity |
| Broad Category | Equity |
| Global Peer Group | Equity Other |
| Peer Group | Specialty/Miscellaneous Funds |
| Global Macro | Equity Other |
| US Macro | Sector Equity Funds |
| YCharts Categorization | -- |
| YCharts Benchmark | -- |
| Prospectus Objective | Specialty/Miscellaneous Funds |
| Fund Owner Firm Name | Nomura Asset Management |
| Broad Asset Class Benchmark Index | |
| ^MSWNTR | 100.0% |
Fundamentals
| General | |
| Distribution Yield | -- |
| Dividend Yield TTM (5-28-26) | 0.72% |
| 30-Day SEC Yield | -- |
| 7-Day SEC Yield | -- |
| Number of Holdings | 37 |
| Stock | |
| Weighted Average PE Ratio | 26.85 |
| Weighted Average Price to Sales Ratio | 2.577 |
| Weighted Average Price to Book Ratio | 3.102 |
| Weighted Median ROE | 10.81% |
| Weighted Median ROA | 4.34% |
| ROI (TTM) | 5.49% |
| Return on Investment (TTM) | 5.49% |
| Earning Yield | 0.0557 |
| LT Debt / Shareholders Equity | 0.7146 |
| Number of Equity Holdings | 31 |
As of March 31, 2026
Growth Metrics
| EPS Growth (1Y) | 15.23% |
| EPS Growth (3Y) | -5.31% |
| EPS Growth (5Y) | 11.99% |
| Sales Growth (1Y) | 2.80% |
| Sales Growth (3Y) | -2.48% |
| Sales Growth (5Y) | 7.45% |
| Sales per Share Growth (1Y) | 2.72% |
| Sales per Share Growth (3Y) | -2.01% |
| Operating Cash Flow - Growth Rate (3Y) | 8.79% |
As of March 31, 2026
Fund Details
| Key Dates | |
| Inception Date | 4/3/2006 |
| Last Annual Report Date | 3/31/2025 |
| Last Prospectus Date | 7/31/2025 |
| Share Classes | |
| IENRX | Retirement |
| IEYAX | A |
| IEYCX | C |
| IVEIX | Inst |
| IYEFX | Retirement |
| Attributes | |
| Index Fund | -- |
| Inverse Fund | No |
| Leveraged Fund | -- |
| Fund of Funds | No |
| Currency Hedged Fund | -- |
| Socially Responsible Fund |
|
Top Portfolio Holders
| Name | % Weight |
|---|---|
| Portfolio A | 5.00% |
| Portfolio B | 3.50% |
| Portfolio C | 2.25% |
Excel Add-In Codes
| Name: =YCI("M:IEYYX", "name") |
| Broad Asset Class: =YCI("M:IEYYX", "broad_asset_class") |
| Broad Category: =YCI("M:IEYYX", "broad_category_group") |
| Prospectus Objective: =YCI("M:IEYYX", "prospectus_objective") |
| To find the codes for any of our securities and financial metrics, see our Complete Excel Reference. |