

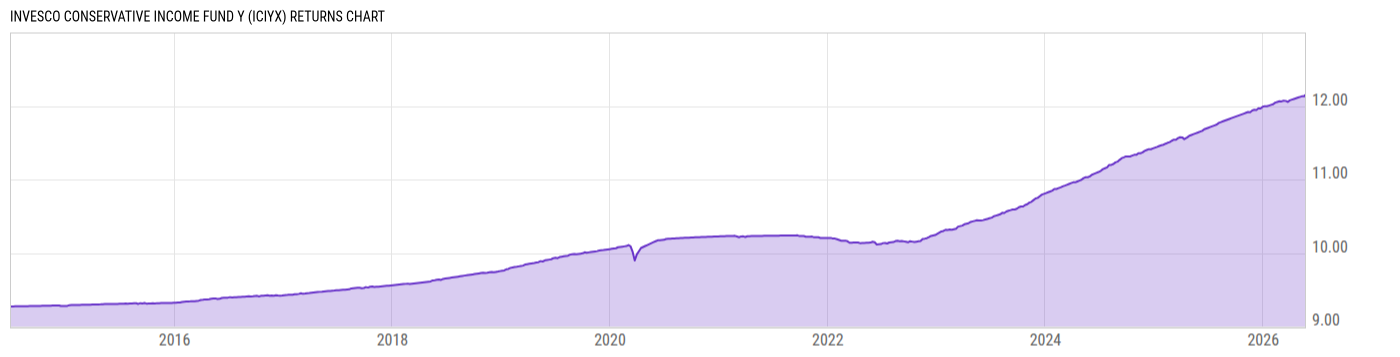
Invesco Conservative Income Fund Y (ICIYX)
10.03
0.00 (0.00%)
USD |
Jun 08 2026
Returns Chart
Key Stats
| Net Expense Ratio | Total Assets Under Management | Weighted Average Dividend Yield | Turnover Ratio (Generic) |
|---|---|---|---|
| 0.36% | 1.753B | -- | 48.00% |
| 1 Year Fund Level Flows | 1 Year Total Returns (Daily) | Annualized Total Returns Since Inception (Daily) | Max Drawdown (Since Inception) |
| 7.468M | 4.28% |
Basic Info
| Investment Strategy | |
| The Fund seeks capital preservation and current income while maintaining liquidity. The Fund invests in money market and fixed income securities and may engage in repurchase agreement transactions collateralized by cash or government securities. It invests more than 25% of its net assets in the financial services sector. |
| General | |
| Security Type | Mutual Fund |
| Equity Style | -- |
| Broad Asset Class | Taxable Bond |
| Broad Category | Fixed Income |
| Global Peer Group | Bond USD Short Term |
| Peer Group | Ultra-Short Obligations Funds |
| Global Macro | Bond Short Term |
| US Macro | Short/Intermediate Investment-Grade Funds |
| YCharts Categorization | -- |
| YCharts Benchmark | -- |
| Prospectus Objective | Ultra-Short Obligations Funds |
| Fund Owner Firm Name | Invesco |
| Broad Asset Class Benchmark Index | |
| ^BBUSATR | 100.0% |
Net Fund Flows Versus Peer Group
1 Month
% Rank:
79
-533.89M
Peer Group Low
1.030B
Peer Group High
1 Year
% Rank:
58
7.468M
-1.377B
Peer Group Low
6.882B
Peer Group High
3 Months
% Rank:
65
-934.15M
Peer Group Low
2.819B
Peer Group High
3 Years
% Rank:
91
-2.738B
Peer Group Low
10.11B
Peer Group High
6 Months
% Rank:
41
-1.072B
Peer Group Low
4.167B
Peer Group High
5 Years
% Rank:
73
-10.77B
Peer Group Low
16.65B
Peer Group High
YTD
% Rank:
38
-834.63M
Peer Group Low
3.692B
Peer Group High
10 Years
% Rank:
25
-5.237B
Peer Group Low
33.03B
Peer Group High
Date Unavailable
Risk
Performance Versus Peer Group
Annual Total Returns Versus Peers
As of June 09, 2026.
Asset Allocation
As of April 30, 2026.
| Type | % Net |
|---|---|
| Cash | 18.88% |
| Stock | 0.00% |
| Bond | 81.12% |
| Convertible | 0.00% |
| Preferred | 0.00% |
| Other | 0.00% |
Top 10 Holdings
| Name | % Weight | Price | % Change |
|---|---|---|---|
|
Santander US Capital Markets LLC Repo
|
1.09% | -- | -- |
|
Citigroup Global Markets Inc Repo
|
1.09% | -- | -- |
|
BofA Securities Inc Repo
|
1.09% | -- | -- |
|
Nomura Securities International Inc Repo
|
1.09% | -- | -- |
| United States of America USGB 3.375 02/29/2028 FIX USD Government | 1.08% | 98.73 | 0.00% |
| Royal Bank of Canada RY 01/19/2027 FLT USD Corporate | 0.91% | 100.40 | 0.00% |
| National Rural Utilities Cooperative Finance Corporation NRUC 09/16/2027 FLT USD Corporate | 0.82% | 100.53 | 0.02% |
| Canadian Imperial Bank of Commerce CM 10/02/2026 FLT USD Corporate | 0.82% | 100.29 | -0.01% |
| Massmutual Global Funding II MASSMU-GlobFund2 01/29/2027 FLT USD Corporate 144A | 0.82% | 100.32 | 0.12% |
| Corebridge Global Funding COREBGL 09/25/2026 FLT USD Corporate 144A | 0.82% | 100.26 | 0.01% |
Fees & Availability
| Fees | |
| Actual 12B-1 Fee | -- |
| Actual Management Fee | 0.23% |
| Administration Fee | -- |
| Maximum Front Load | -- |
| Maximum Deferred Load | -- |
| Maximum Redemption Fee | -- |
| General Availability | |
| Available for Insurance Product | No |
| Available for RRSP | No |
| Purchase Details | |
| Open to New Investors |
|
| Minimum Initial Investment | 1000.00 None |
| Minimum Subsequent Investment | 50.00 None |
Basic Info
| Investment Strategy | |
| The Fund seeks capital preservation and current income while maintaining liquidity. The Fund invests in money market and fixed income securities and may engage in repurchase agreement transactions collateralized by cash or government securities. It invests more than 25% of its net assets in the financial services sector. |
| General | |
| Security Type | Mutual Fund |
| Equity Style | -- |
| Broad Asset Class | Taxable Bond |
| Broad Category | Fixed Income |
| Global Peer Group | Bond USD Short Term |
| Peer Group | Ultra-Short Obligations Funds |
| Global Macro | Bond Short Term |
| US Macro | Short/Intermediate Investment-Grade Funds |
| YCharts Categorization | -- |
| YCharts Benchmark | -- |
| Prospectus Objective | Ultra-Short Obligations Funds |
| Fund Owner Firm Name | Invesco |
| Broad Asset Class Benchmark Index | |
| ^BBUSATR | 100.0% |
Fundamentals
| General | |
| Distribution Yield | -- |
| Dividend Yield TTM (6-5-26) | 4.44% |
| 30-Day SEC Yield (5-31-26) | 3.94% |
| 7-Day SEC Yield | -- |
| Number of Holdings | 260 |
| Bond | |
| Yield to Maturity (4-30-26) | 4.26% |
| Effective Duration | 0.51 |
| Average Coupon | 4.51% |
| Calculated Average Quality | 2.665 |
| Effective Maturity | 2.090 |
| Nominal Maturity | 2.093 |
| Number of Bond Holdings | 216 |
As of April 30, 2026
Fund Details
Top Portfolio Holders
| Name | % Weight |
|---|---|
| Portfolio A | 5.00% |
| Portfolio B | 3.50% |
| Portfolio C | 2.25% |
Excel Add-In Codes
| Name: =YCI("M:ICIYX", "name") |
| Broad Asset Class: =YCI("M:ICIYX", "broad_asset_class") |
| Broad Category: =YCI("M:ICIYX", "broad_category_group") |
| Prospectus Objective: =YCI("M:ICIYX", "prospectus_objective") |
| To find the codes for any of our securities and financial metrics, see our Complete Excel Reference. |