

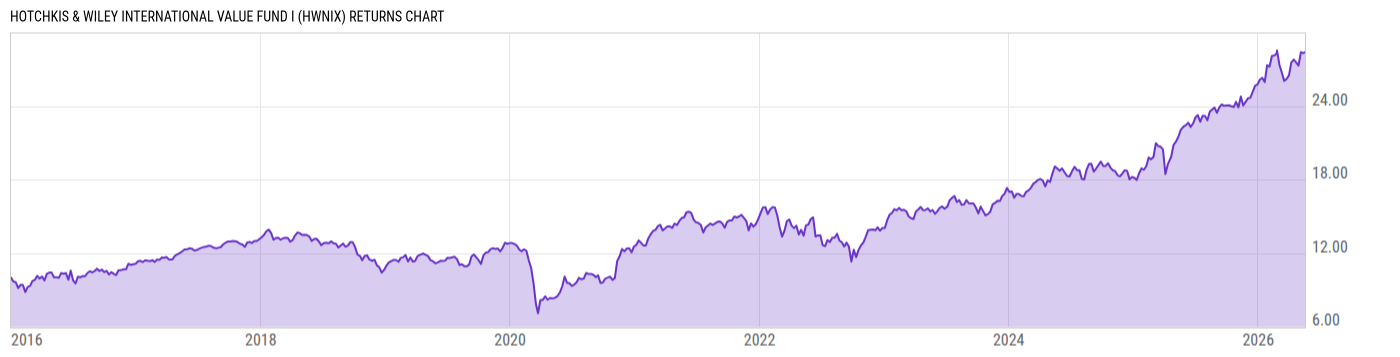
Hotchkis & Wiley International Value Fund I (HWNIX)
15.21
+0.05
(+0.33%)
USD |
Jun 09 2026
Returns Chart
Key Stats
| Net Expense Ratio | Total Assets Under Management | Weighted Average Dividend Yield | Turnover Ratio (Generic) |
|---|---|---|---|
| 0.70% | 4.733M | 3.07% | 35.00% |
| 1 Year Fund Level Flows | 1 Year Total Returns (Daily) | Annualized Total Returns Since Inception (Daily) | Max Drawdown (Since Inception) |
| -746610.0 | 26.95% |
Basic Info
| Investment Strategy | |
| The Fund seeks capital appreciation. The Fund seeks to achieve its objective by investing primarily in non-U.S. companies, which may include companies located or operating in developed or emerging markets. It will allocate its assets among various regions and countries of any size market capitalization. |
| General | |
| Security Type | Mutual Fund |
| Equity Style | Multi Cap Value |
| Broad Asset Class | International Equity |
| Broad Category | Equity |
| Global Peer Group | Equity Global ex US |
| Peer Group | International Multi-Cap Value |
| Global Macro | Equity Global |
| US Macro | Developed International Markets Funds |
| YCharts Categorization | -- |
| YCharts Benchmark | -- |
| Prospectus Objective | International Funds |
| Fund Owner Firm Name | Hotchkis & Wiley |
| Broad Asset Class Benchmark Index | |
| ^MSACXUSNTR | 100.0% |
Net Fund Flows Versus Peer Group
1 Month
% Rank:
46
-883.06M
Peer Group Low
485.37M
Peer Group High
1 Year
% Rank:
55
-746610.0
-3.080B
Peer Group Low
3.732B
Peer Group High
3 Months
% Rank:
45
-1.258B
Peer Group Low
1.136B
Peer Group High
3 Years
% Rank:
41
-12.16B
Peer Group Low
7.251B
Peer Group High
6 Months
% Rank:
50
-2.103B
Peer Group Low
2.456B
Peer Group High
5 Years
% Rank:
38
-16.98B
Peer Group Low
8.941B
Peer Group High
YTD
% Rank:
46
-2.004B
Peer Group Low
2.211B
Peer Group High
10 Years
% Rank:
49
-22.42B
Peer Group Low
8.541B
Peer Group High
Date Unavailable
Risk
Performance Versus Peer Group
Annual Total Returns Versus Peers
As of June 10, 2026.
Asset Allocation
As of March 31, 2026.
| Type | % Net |
|---|---|
| Cash | 8.24% |
| Stock | 94.91% |
| Bond | 0.00% |
| Convertible | 0.00% |
| Preferred | 0.88% |
| Other | -4.02% |
Top 10 Holdings
| Name | % Weight | Price | % Change |
|---|---|---|---|
|
USD CASH
|
8.24% | -- | -- |
| SAP SE | 4.09% | 179.23 | -1.20% |
| Telefonaktiebolaget LM Ericsson | 4.01% | 12.61 | 0.00% |
| Shell Plc | 3.99% | 43.40 | 2.04% |
| TotalEnergies SE | 3.83% | 88.48 | -0.17% |
| Akzo Nobel NV | 3.72% | 66.68 | 0.00% |
|
FUSO CHEMICAL CO LTD ORD
|
3.34% | -- | -- |
| Henkel AG & Co. KGaA | 3.14% | 69.35 | 0.00% |
| Heineken Holding NV | 3.00% | 70.90 | 3.58% |
| Nippon Sanso Holdings Corp. | 2.67% | 31.43 | -12.19% |
Fees & Availability
| Fees | |
| Actual 12B-1 Fee | -- |
| Actual Management Fee | -- |
| Administration Fee | 75.26K% |
| Maximum Front Load | -- |
| Maximum Deferred Load | -- |
| Maximum Redemption Fee | -- |
| General Availability | |
| Available for Insurance Product | No |
| Available for RRSP | No |
| Purchase Details | |
| Open to New Investors |
|
| Minimum Initial Investment | 250000.0 None |
| Minimum Subsequent Investment | 100.00 None |
Basic Info
| Investment Strategy | |
| The Fund seeks capital appreciation. The Fund seeks to achieve its objective by investing primarily in non-U.S. companies, which may include companies located or operating in developed or emerging markets. It will allocate its assets among various regions and countries of any size market capitalization. |
| General | |
| Security Type | Mutual Fund |
| Equity Style | Multi Cap Value |
| Broad Asset Class | International Equity |
| Broad Category | Equity |
| Global Peer Group | Equity Global ex US |
| Peer Group | International Multi-Cap Value |
| Global Macro | Equity Global |
| US Macro | Developed International Markets Funds |
| YCharts Categorization | -- |
| YCharts Benchmark | -- |
| Prospectus Objective | International Funds |
| Fund Owner Firm Name | Hotchkis & Wiley |
| Broad Asset Class Benchmark Index | |
| ^MSACXUSNTR | 100.0% |
Fundamentals
| General | |
| Distribution Yield | -- |
| Dividend Yield TTM (6-8-26) | 2.49% |
| 30-Day SEC Yield (12-30-22) | 2.59% |
| 7-Day SEC Yield | -- |
| Number of Holdings | 57 |
| Stock | |
| Weighted Average PE Ratio | 19.19 |
| Weighted Average Price to Sales Ratio | 2.199 |
| Weighted Average Price to Book Ratio | 2.813 |
| Weighted Median ROE | 16.11% |
| Weighted Median ROA | 4.58% |
| ROI (TTM) | 8.60% |
| Return on Investment (TTM) | 8.60% |
| Earning Yield | 0.0654 |
| LT Debt / Shareholders Equity | 1.045 |
| Number of Equity Holdings | 53 |
As of March 31, 2026
Growth Metrics
| EPS Growth (1Y) | 24.10% |
| EPS Growth (3Y) | 9.83% |
| EPS Growth (5Y) | 9.75% |
| Sales Growth (1Y) | 1.59% |
| Sales Growth (3Y) | 3.20% |
| Sales Growth (5Y) | 7.88% |
| Sales per Share Growth (1Y) | 2.36% |
| Sales per Share Growth (3Y) | 4.22% |
| Operating Cash Flow - Growth Rate (3Y) | 8.03% |
As of March 31, 2026
Fund Details
| Key Dates | |
| Inception Date | 12/31/2015 |
| Last Annual Report Date | 6/30/2025 |
| Last Prospectus Date | 8/29/2025 |
| Attributes | |
| Index Fund | -- |
| Inverse Fund | No |
| Leveraged Fund | -- |
| Fund of Funds | No |
| Currency Hedged Fund | -- |
| Socially Responsible Fund | No |
Top Portfolio Holders
| Name | % Weight |
|---|---|
| Portfolio A | 5.00% |
| Portfolio B | 3.50% |
| Portfolio C | 2.25% |
Excel Add-In Codes
| Name: =YCI("M:HWNIX", "name") |
| Broad Asset Class: =YCI("M:HWNIX", "broad_asset_class") |
| Broad Category: =YCI("M:HWNIX", "broad_category_group") |
| Prospectus Objective: =YCI("M:HWNIX", "prospectus_objective") |
| To find the codes for any of our securities and financial metrics, see our Complete Excel Reference. |