

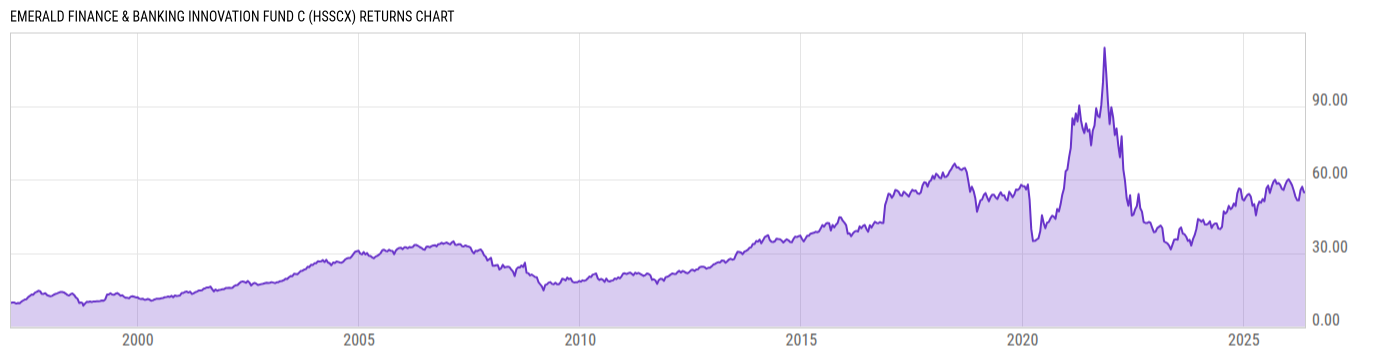
Emerald Finance & Banking Innovation Fund C (HSSCX)
24.45
+0.05
(+0.20%)
USD |
Jun 10 2026
Returns Chart
Key Stats
| Net Expense Ratio | Total Assets Under Management | Weighted Average Dividend Yield | Turnover Ratio (Generic) |
|---|---|---|---|
| 2.44% | 42.98M | 0.71% | 32.00% |
| 1 Year Fund Level Flows | 1 Year Total Returns (Daily) | Annualized Total Returns Since Inception (Daily) | Max Drawdown (Since Inception) |
| -8.539M | 6.03% |
Basic Info
| Investment Strategy | |
| The Fund seeks long-term growth through capital appreciation. Income is a secondary objective. The Fund invests at least 80% of its net assets in a portfolio of equity securities of companies principally engaged in the banking or financial services industries and also, the Fund will usually emphasize small companies. |
| General | |
| Security Type | Mutual Fund |
| Equity Style | Small Cap Core |
| Broad Asset Class | Sector Equity |
| Broad Category | Equity |
| Global Peer Group | Equity Sector Financials |
| Peer Group | Financial Services Funds |
| Global Macro | Equity Industry Sector |
| US Macro | Sector Equity Funds |
| YCharts Categorization | -- |
| YCharts Benchmark | -- |
| Prospectus Objective | Financial Services Funds |
| Fund Owner Firm Name | Emerald Mutual Funds |
| Broad Asset Class Benchmark Index | |
| ^MSWNTR | 100.0% |
Net Fund Flows Versus Peer Group
1 Month
% Rank:
40
-1.155B
Peer Group Low
134.43M
Peer Group High
1 Year
% Rank:
29
-8.539M
-1.292B
Peer Group Low
202.72M
Peer Group High
3 Months
% Rank:
22
-735.00M
Peer Group Low
86.31M
Peer Group High
3 Years
% Rank:
54
-690.51M
Peer Group Low
1.877B
Peer Group High
6 Months
% Rank:
35
-1.126B
Peer Group Low
129.49M
Peer Group High
5 Years
% Rank:
63
-8.849B
Peer Group Low
1.605B
Peer Group High
YTD
% Rank:
29
-1.089B
Peer Group Low
82.88M
Peer Group High
10 Years
% Rank:
80
-2.931B
Peer Group Low
2.952B
Peer Group High
Date Unavailable
Risk
Performance Versus Peer Group
Annual Total Returns Versus Peers
As of June 11, 2026.
Asset Allocation
As of April 30, 2026.
| Type | % Net |
|---|---|
| Cash | 0.66% |
| Stock | 98.31% |
| Bond | 0.72% |
| Convertible | 0.00% |
| Preferred | 0.00% |
| Other | 0.32% |
Top 10 Holdings
| Name | % Weight | Price | % Change |
|---|---|---|---|
| Customers Bancorp, Inc. | 4.88% | 77.16 | 1.65% |
| Axos Financial, Inc. | 4.85% | 89.26 | 1.26% |
| Northeast Bank (Maine) | 4.79% | 128.55 | 1.38% |
| Metropolitan Bank Holding Corp. | 4.61% | 95.72 | 1.95% |
| LendingClub Corp. | 4.48% | 18.24 | 5.92% |
| The Bancorp, Inc. (Delaware) | 4.46% | 56.50 | 2.82% |
| Esquire Financial Holdings, Inc. | 4.41% | 113.02 | 0.96% |
| Pathward Financial, Inc. | 4.22% | 82.96 | 1.74% |
| Coastal Financial Corp. (Washington) | 3.53% | 72.09 | 1.08% |
| Pinnacle Financial Partners, Inc. | 3.21% | 93.72 | 0.66% |
Fees & Availability
| Fees | |
| Actual 12B-1 Fee | 0.75% |
| Actual Management Fee | 1.00% |
| Administration Fee | 2.32K% |
| Maximum Front Load | 0.00% |
| Maximum Deferred Load | 1.00% |
| Maximum Redemption Fee | 0.00% |
| General Availability | |
| Available for Insurance Product | No |
| Available for RRSP | No |
| Purchase Details | |
| Open to New Investors |
|
| Minimum Initial Investment | 2000.00 None |
| Minimum Subsequent Investment | 100.00 None |
Basic Info
| Investment Strategy | |
| The Fund seeks long-term growth through capital appreciation. Income is a secondary objective. The Fund invests at least 80% of its net assets in a portfolio of equity securities of companies principally engaged in the banking or financial services industries and also, the Fund will usually emphasize small companies. |
| General | |
| Security Type | Mutual Fund |
| Equity Style | Small Cap Core |
| Broad Asset Class | Sector Equity |
| Broad Category | Equity |
| Global Peer Group | Equity Sector Financials |
| Peer Group | Financial Services Funds |
| Global Macro | Equity Industry Sector |
| US Macro | Sector Equity Funds |
| YCharts Categorization | -- |
| YCharts Benchmark | -- |
| Prospectus Objective | Financial Services Funds |
| Fund Owner Firm Name | Emerald Mutual Funds |
| Broad Asset Class Benchmark Index | |
| ^MSWNTR | 100.0% |
Fundamentals
| General | |
| Distribution Yield | -- |
| Dividend Yield TTM (6-10-26) | 0.00% |
| 30-Day SEC Yield | -- |
| 7-Day SEC Yield | -- |
| Number of Holdings | 62 |
| Stock | |
| Weighted Average PE Ratio | 17.81 |
| Weighted Average Price to Sales Ratio | 4.418 |
| Weighted Average Price to Book Ratio | 2.821 |
| Weighted Median ROE | 16.11% |
| Weighted Median ROA | 2.86% |
| ROI (TTM) | 15.30% |
| Return on Investment (TTM) | 15.30% |
| Earning Yield | 0.0732 |
| LT Debt / Shareholders Equity | 0.7298 |
| Number of Equity Holdings | 60 |
As of April 30, 2026
Growth Metrics
| EPS Growth (1Y) | 29.21% |
| EPS Growth (3Y) | 10.46% |
| EPS Growth (5Y) | 21.48% |
| Sales Growth (1Y) | 23.51% |
| Sales Growth (3Y) | 18.92% |
| Sales Growth (5Y) | 21.42% |
| Sales per Share Growth (1Y) | 18.78% |
| Sales per Share Growth (3Y) | 19.96% |
| Operating Cash Flow - Growth Rate (3Y) | 23.17% |
As of April 30, 2026
Fund Details
Top Portfolio Holders
| Name | % Weight |
|---|---|
| Portfolio A | 5.00% |
| Portfolio B | 3.50% |
| Portfolio C | 2.25% |
Excel Add-In Codes
| Name: =YCI("M:HSSCX", "name") |
| Broad Asset Class: =YCI("M:HSSCX", "broad_asset_class") |
| Broad Category: =YCI("M:HSSCX", "broad_category_group") |
| Prospectus Objective: =YCI("M:HSSCX", "prospectus_objective") |
| To find the codes for any of our securities and financial metrics, see our Complete Excel Reference. |