

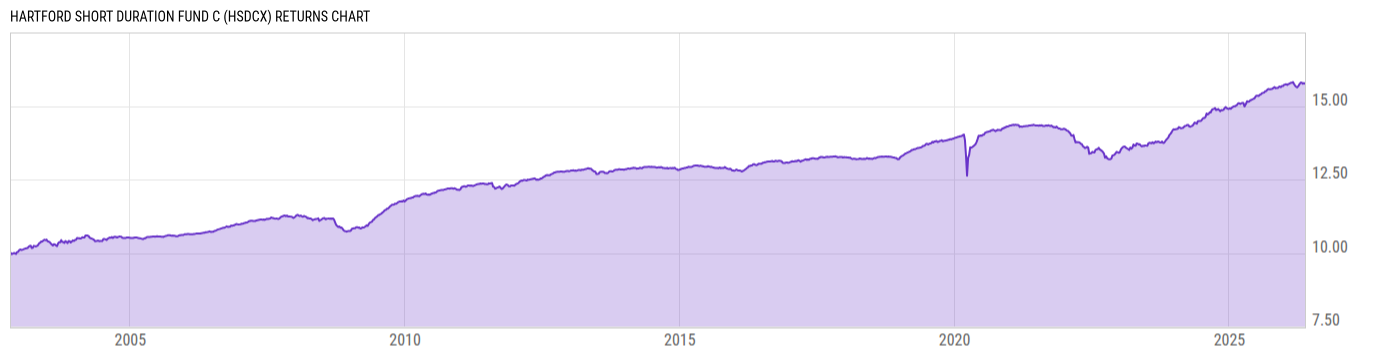
Hartford Short Duration Fund C (HSDCX)
9.76
0.00 (0.00%)
USD |
Jun 08 2026
Returns Chart
Key Stats
| Net Expense Ratio | Total Assets Under Management | Weighted Average Dividend Yield | Turnover Ratio (Generic) |
|---|---|---|---|
| 1.53% | 2.269B | -- | 50.00% |
| 1 Year Fund Level Flows | 1 Year Total Returns (Daily) | Annualized Total Returns Since Inception (Daily) | Max Drawdown (Since Inception) |
| 204.18M | 3.63% |
Basic Info
| Investment Strategy | |
| The Fund seeks to provide a high level of income by investing only in securities of "investment grade" quality. This means securities that are rated at the time of purchase within the four highest categories assigned by. |
| General | |
| Security Type | Mutual Fund |
| Equity Style | -- |
| Broad Asset Class | Taxable Bond |
| Broad Category | Fixed Income |
| Global Peer Group | Bond USD Short Term |
| Peer Group | Short Investment Grade Debt Funds |
| Global Macro | Bond Short Term |
| US Macro | Short/Intermediate Investment-Grade Funds |
| YCharts Categorization | -- |
| YCharts Benchmark | -- |
| Prospectus Objective | Short Investment Grade Debt Funds |
| Fund Owner Firm Name | Hartford Funds |
| Broad Asset Class Benchmark Index | |
| ^BBUSATR | 100.0% |
Net Fund Flows Versus Peer Group
1 Month
% Rank:
30
-45.67M
Peer Group Low
1.895B
Peer Group High
1 Year
% Rank:
20
204.18M
-5.690B
Peer Group Low
8.661B
Peer Group High
3 Months
% Rank:
50
-2.968B
Peer Group Low
3.650B
Peer Group High
3 Years
% Rank:
29
-10.63B
Peer Group Low
8.661B
Peer Group High
6 Months
% Rank:
27
-4.269B
Peer Group Low
8.661B
Peer Group High
5 Years
% Rank:
33
-27.43B
Peer Group Low
9.200B
Peer Group High
YTD
% Rank:
33
-3.260B
Peer Group Low
8.660B
Peer Group High
10 Years
% Rank:
19
-11.15B
Peer Group Low
23.88B
Peer Group High
Date Unavailable
Risk
Performance Versus Peer Group
Annual Total Returns Versus Peers
As of June 09, 2026.
Asset Allocation
As of March 31, 2026.
| Type | % Net |
|---|---|
| Cash | 0.29% |
| Stock | 0.00% |
| Bond | 98.96% |
| Convertible | 0.00% |
| Preferred | 0.00% |
| Other | 0.75% |
Top 10 Holdings
| Name | % Weight | Price | % Change |
|---|---|---|---|
|
2YR T-NOTE JUN26
|
21.01% | -- | -- |
| United States of America USGB 4.375 01/31/2032 FIX USD Government | 3.56% | 100.16 | -0.04% |
|
FEDERAL NATIONAL MORTGAGE ASSOCIATION 01-SEP-2055 FA3732
|
1.83% | -- | -- |
|
FEDERAL NATIONAL MORTGAGE ASSOCIATION 01-SEP-2054 FS9438
|
0.96% | -- | -- |
|
FEDERAL HOME LOAN MORTGAGE CORP 01-DEC-2054 SL0199
|
0.96% | -- | -- |
|
FEDERAL HOME LOAN MORTGAGE CORP 01-JUL-2055 SL2043
|
0.91% | -- | -- |
|
FEDERAL NATIONAL MORTGAGE ASSOCIATION 01-JUL-2054 FA3211
|
0.86% | -- | -- |
|
FEDERAL NATIONAL MORTGAGE ASSOCIATION 01-JUL-2054 CB8846
|
0.85% | -- | -- |
|
FEDERAL NATIONAL MORTGAGE ASSOCIATION 01-FEB-2054 FS6786
|
0.82% | -- | -- |
| United States of America USGB 0.5 04/30/2027 FIX USD Government | 0.78% | 97.01 | 0.01% |
Fees & Availability
| Fees | |
| Actual 12B-1 Fee | 1.00% |
| Actual Management Fee | 0.38% |
| Administration Fee | -- |
| Maximum Front Load | 0.00% |
| Maximum Deferred Load | 1.00% |
| Maximum Redemption Fee | -- |
| General Availability | |
| Available for Insurance Product | -- |
| Available for RRSP | -- |
| Purchase Details | |
| Open to New Investors |
|
| Minimum Initial Investment | 2000.00 None |
| Minimum Subsequent Investment | 50.00 None |
Basic Info
| Investment Strategy | |
| The Fund seeks to provide a high level of income by investing only in securities of "investment grade" quality. This means securities that are rated at the time of purchase within the four highest categories assigned by. |
| General | |
| Security Type | Mutual Fund |
| Equity Style | -- |
| Broad Asset Class | Taxable Bond |
| Broad Category | Fixed Income |
| Global Peer Group | Bond USD Short Term |
| Peer Group | Short Investment Grade Debt Funds |
| Global Macro | Bond Short Term |
| US Macro | Short/Intermediate Investment-Grade Funds |
| YCharts Categorization | -- |
| YCharts Benchmark | -- |
| Prospectus Objective | Short Investment Grade Debt Funds |
| Fund Owner Firm Name | Hartford Funds |
| Broad Asset Class Benchmark Index | |
| ^BBUSATR | 100.0% |
Fundamentals
| General | |
| Distribution Yield | -- |
| Dividend Yield TTM (6-5-26) | 3.61% |
| 30-Day SEC Yield (5-31-26) | 3.69% |
| 7-Day SEC Yield | -- |
| Number of Holdings | 738 |
| Bond | |
| Yield to Maturity (3-31-26) | 5.09% |
| Effective Duration | 2.09 |
| Average Coupon | 4.93% |
| Calculated Average Quality | 3.295 |
| Effective Maturity | 11.62 |
| Nominal Maturity | 11.66 |
| Number of Bond Holdings | 674 |
As of March 31, 2026
Fund Details
| Key Dates | |
| Inception Date | 10/31/2002 |
| Last Annual Report Date | 10/31/2025 |
| Last Prospectus Date | 2/27/2026 |
| Share Classes | |
| HSDAX | A |
| HSDFX | F |
| HSDIX | Inst |
| HSDRX | Retirement |
| HSDSX | Retirement |
| HSDTX | Retirement |
| HSDVX | Retirement |
| HSDYX | Inst |
| Attributes | |
| Index Fund | -- |
| Inverse Fund | -- |
| Leveraged Fund | -- |
| Fund of Funds | No |
| Currency Hedged Fund | -- |
| Socially Responsible Fund | No |
Top Portfolio Holders
| Name | % Weight |
|---|---|
| Portfolio A | 5.00% |
| Portfolio B | 3.50% |
| Portfolio C | 2.25% |
Excel Add-In Codes
| Name: =YCI("M:HSDCX", "name") |
| Broad Asset Class: =YCI("M:HSDCX", "broad_asset_class") |
| Broad Category: =YCI("M:HSDCX", "broad_category_group") |
| Prospectus Objective: =YCI("M:HSDCX", "prospectus_objective") |
| To find the codes for any of our securities and financial metrics, see our Complete Excel Reference. |