

Hartford Real Asset Fund R5 (HRLTX)
10.80
-0.06
(-0.55%)
USD |
May 27 2026
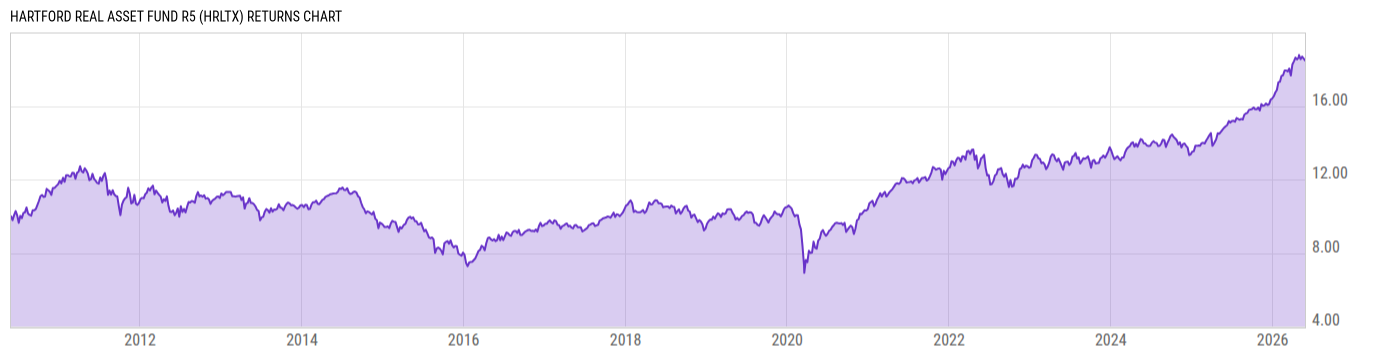
Returns Chart
Key Stats
| Net Expense Ratio | Total Assets Under Management | Weighted Average Dividend Yield | Turnover Ratio (Generic) |
|---|---|---|---|
| 0.95% | 68.65M | 3.03% | 149.0% |
| 1 Year Fund Level Flows | 1 Year Total Returns (Daily) | Annualized Total Returns Since Inception (Daily) | Max Drawdown (Since Inception) |
| -6.240M | 24.71% |
Basic Info
| Investment Strategy | |
| The Fund seeks to provide long-term total returns that outpace inflation over a macroeconomic cycle. The Fund seeks to achieve its objective by investing in a globally diverse mix of inflation-related equity investments (primarily equities securities of natural resource companies), inflation-linked bonds and commodities. |
| General | |
| Security Type | Mutual Fund |
| Equity Style | Multi Cap Value |
| Broad Asset Class | Allocation |
| Broad Category | Allocation |
| Global Peer Group | Mixed Asset USD Flexible - Global |
| Peer Group | Real Return Funds |
| Global Macro | Mixed Asset HC Flexible |
| US Macro | Mixed-Assets Funds |
| YCharts Categorization | -- |
| YCharts Benchmark | -- |
| Prospectus Objective | Real Return Funds |
| Fund Owner Firm Name | Hartford Funds |
| Broad Asset Class Benchmark Index | |
| ^SPXTR | 100.0% |
Net Fund Flows Versus Peer Group
1 Month
% Rank:
42
-150.24M
Peer Group Low
167.03M
Peer Group High
1 Year
% Rank:
42
-6.240M
-3.392B
Peer Group Low
675.56M
Peer Group High
3 Months
% Rank:
44
-1.092B
Peer Group Low
473.36M
Peer Group High
3 Years
% Rank:
50
-2.135B
Peer Group Low
648.85M
Peer Group High
6 Months
% Rank:
52
-2.547B
Peer Group Low
605.21M
Peer Group High
5 Years
% Rank:
74
-2.782B
Peer Group Low
1.853B
Peer Group High
YTD
% Rank:
49
-1.472B
Peer Group Low
559.85M
Peer Group High
10 Years
% Rank:
74
-2.877B
Peer Group Low
3.052B
Peer Group High
Date Unavailable
Risk
Performance Versus Peer Group
Annual Total Returns Versus Peers
As of May 28, 2026.
Asset Allocation
As of March 31, 2026.
| Type | % Net |
|---|---|
| Cash | 0.12% |
| Stock | 49.47% |
| Bond | 27.95% |
| Convertible | 0.00% |
| Preferred | 0.00% |
| Other | 22.46% |
Top 10 Holdings
| Name | % Weight | Price | % Change |
|---|---|---|---|
|
Global Real Asset Cayman Mutual Fund
|
21.35% | -- | -- |
| Shell Plc | 2.64% | 84.10 | 0.35% |
| TotalEnergies SE | 2.45% | 87.38 | 0.83% |
| Exxon Mobil Corp. | 1.90% | 147.60 | -0.20% |
| Equinor ASA | 1.66% | 37.46 | 0.08% |
| United States of America USGB 1.875 07/15/2035 FIX USD Government | 1.28% | 99.08 | 0.07% |
| United States of America USGB 2.125 01/15/2035 FIX USD Government | 1.27% | 101.11 | 0.06% |
| United States of America USGB 1.875 07/15/2034 FIX USD Government | 1.20% | 99.91 | 0.06% |
| United States of America USGB 1.75 01/15/2034 FIX USD Government | 1.14% | 99.01 | 0.05% |
|
Other Assets less Liabilities
|
1.10% | -- | -- |
Fees & Availability
| Fees | |
| Actual 12B-1 Fee | -- |
| Actual Management Fee | 0.34% |
| Administration Fee | -- |
| Maximum Front Load | -- |
| Maximum Deferred Load | -- |
| Maximum Redemption Fee | -- |
| General Availability | |
| Available for Insurance Product | No |
| Available for RRSP | No |
| Purchase Details | |
| Open to New Investors |
|
| Minimum Initial Investment | 0.00 None |
| Minimum Subsequent Investment | 0.00 None |
Basic Info
| Investment Strategy | |
| The Fund seeks to provide long-term total returns that outpace inflation over a macroeconomic cycle. The Fund seeks to achieve its objective by investing in a globally diverse mix of inflation-related equity investments (primarily equities securities of natural resource companies), inflation-linked bonds and commodities. |
| General | |
| Security Type | Mutual Fund |
| Equity Style | Multi Cap Value |
| Broad Asset Class | Allocation |
| Broad Category | Allocation |
| Global Peer Group | Mixed Asset USD Flexible - Global |
| Peer Group | Real Return Funds |
| Global Macro | Mixed Asset HC Flexible |
| US Macro | Mixed-Assets Funds |
| YCharts Categorization | -- |
| YCharts Benchmark | -- |
| Prospectus Objective | Real Return Funds |
| Fund Owner Firm Name | Hartford Funds |
| Broad Asset Class Benchmark Index | |
| ^SPXTR | 100.0% |
Fundamentals
| General | |
| Distribution Yield | -- |
| Dividend Yield TTM (5-26-26) | 3.48% |
| 30-Day SEC Yield | -- |
| 7-Day SEC Yield | -- |
| Number of Holdings | 209 |
| Stock | |
| Weighted Average PE Ratio | 21.50 |
| Weighted Average Price to Sales Ratio | 3.480 |
| Weighted Average Price to Book Ratio | 2.647 |
| Weighted Median ROE | 13.99% |
| Weighted Median ROA | 6.00% |
| ROI (TTM) | 9.64% |
| Return on Investment (TTM) | 9.64% |
| Earning Yield | 0.0589 |
| LT Debt / Shareholders Equity | 0.6920 |
| Number of Equity Holdings | 146 |
| Bond | |
| Yield to Maturity (3-31-26) | 1.62% |
| Effective Duration | -- |
| Average Coupon | 1.46% |
| Calculated Average Quality | 2.160 |
| Effective Maturity | 5.102 |
| Nominal Maturity | 5.102 |
| Number of Bond Holdings | 35 |
As of March 31, 2026
Growth Metrics
| EPS Growth (1Y) | 27.72% |
| EPS Growth (3Y) | -1.84% |
| EPS Growth (5Y) | 12.63% |
| Sales Growth (1Y) | 7.10% |
| Sales Growth (3Y) | 1.22% |
| Sales Growth (5Y) | 9.71% |
| Sales per Share Growth (1Y) | 7.32% |
| Sales per Share Growth (3Y) | 1.10% |
| Operating Cash Flow - Growth Rate (3Y) | 3.41% |
As of March 31, 2026
Fund Details
| Key Dates | |
| Inception Date | 5/28/2010 |
| Last Annual Report Date | 10/31/2025 |
| Last Prospectus Date | 2/27/2026 |
| Share Classes | |
| HRLAX | A |
| HRLCX | C |
| HRLFX | F |
| HRLIX | Inst |
| HRLRX | Retirement |
| HRLSX | Retirement |
| HRLYX | Inst |
| HRLZX | Retirement |
| Attributes | |
| Index Fund | -- |
| Inverse Fund | No |
| Leveraged Fund | -- |
| Fund of Funds | No |
| Currency Hedged Fund | -- |
| Socially Responsible Fund | No |
Top Portfolio Holders
| Name | % Weight |
|---|---|
| Portfolio A | 5.00% |
| Portfolio B | 3.50% |
| Portfolio C | 2.25% |
Excel Add-In Codes
| Name: =YCI("M:HRLTX", "name") |
| Broad Asset Class: =YCI("M:HRLTX", "broad_asset_class") |
| Broad Category: =YCI("M:HRLTX", "broad_category_group") |
| Prospectus Objective: =YCI("M:HRLTX", "prospectus_objective") |
| To find the codes for any of our securities and financial metrics, see our Complete Excel Reference. |