

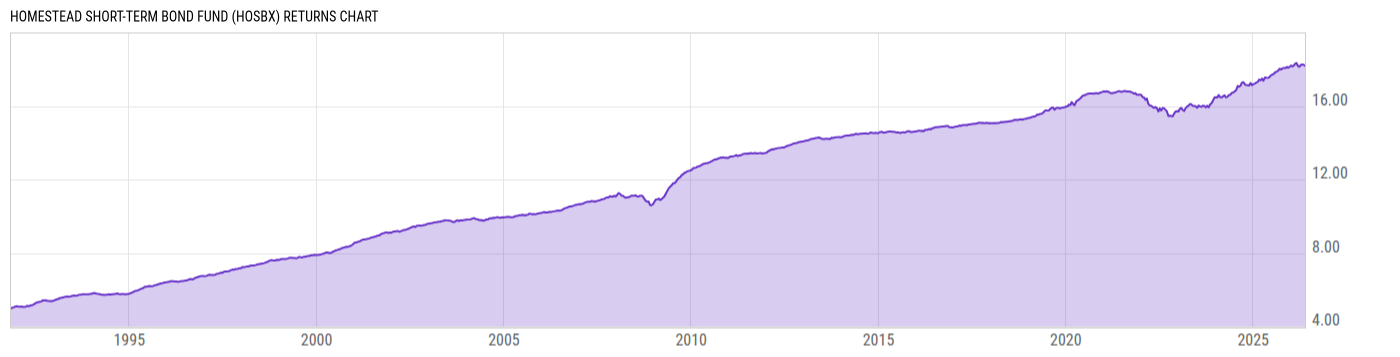
Homestead Short-Term Bond Fund (HOSBX)
4.94
+0.01
(+0.20%)
USD |
Jun 09 2026
Returns Chart
Key Stats
| Net Expense Ratio | Total Assets Under Management | Weighted Average Dividend Yield | Turnover Ratio (Generic) |
|---|---|---|---|
| 0.76% | 419.37M | -- | 265.0% |
| 1 Year Fund Level Flows | 1 Year Total Returns (Daily) | Annualized Total Returns Since Inception (Daily) | Max Drawdown (Since Inception) |
| -20.49M | 3.61% |
Basic Info
| Investment Strategy | |
| The Fund seeks to provide a high level of current income consistent with stability of principal and current liquidity by investing in high-grade, short-term debt securities. |
| General | |
| Security Type | Mutual Fund |
| Equity Style | -- |
| Broad Asset Class | Taxable Bond |
| Broad Category | Fixed Income |
| Global Peer Group | Bond USD Short Term |
| Peer Group | Short Investment Grade Debt Funds |
| Global Macro | Bond Short Term |
| US Macro | Short/Intermediate Investment-Grade Funds |
| YCharts Categorization | -- |
| YCharts Benchmark | -- |
| Prospectus Objective | Short Investment Grade Debt Funds |
| Fund Owner Firm Name | Homestead Funds |
| Broad Asset Class Benchmark Index | |
| ^BBUSATR | 100.0% |
Net Fund Flows Versus Peer Group
1 Month
% Rank:
61
-45.67M
Peer Group Low
1.895B
Peer Group High
1 Year
% Rank:
67
-20.49M
-5.690B
Peer Group Low
8.661B
Peer Group High
3 Months
% Rank:
64
-2.968B
Peer Group Low
3.650B
Peer Group High
3 Years
% Rank:
67
-10.63B
Peer Group Low
8.661B
Peer Group High
6 Months
% Rank:
66
-4.269B
Peer Group Low
8.661B
Peer Group High
5 Years
% Rank:
62
-27.43B
Peer Group Low
9.200B
Peer Group High
YTD
% Rank:
67
-3.260B
Peer Group Low
8.660B
Peer Group High
10 Years
% Rank:
68
-11.15B
Peer Group Low
23.88B
Peer Group High
Date Unavailable
Risk
Performance Versus Peer Group
Annual Total Returns Versus Peers
As of June 10, 2026.
Asset Allocation
As of March 31, 2026.
| Type | % Net |
|---|---|
| Cash | 0.91% |
| Stock | 0.00% |
| Bond | 99.09% |
| Convertible | 0.00% |
| Preferred | 0.00% |
| Other | 0.00% |
Top 10 Holdings
| Name | % Weight | Price | % Change |
|---|---|---|---|
| United States of America USGB 3.5 03/15/2029 FIX USD Government | 18.53% | 98.26 | 0.09% |
| United States of America USGB 3.875 03/31/2028 FIX USD Government | 10.97% | 99.56 | 0.06% |
| United States of America USGB 3.875 03/31/2031 FIX USD Government | 1.95% | 98.52 | 0.14% |
| State Street US Government Money Market Fund Prem | 1.84% | 1.00 | 0.00% |
| Wells Fargo & Company WFC 5.244 01/24/2031 FLT USD Corporate '30 | 1.31% | 101.25 | 0.16% |
| Citigroup Inc. C 5.174 02/13/2030 FLT USD Corporate '29 | 1.09% | 101.03 | 0.07% |
| Government National Mortgage Association GNMA 5.0 11/20/2053 FIX USD Agency | 1.03% | 100.01 | -0.03% |
|
GOVERNMENT NATIONAL MORTGAGE ASSOCIATION 2525J PJ PAC FIX 4.5% 20-FEB-2054
|
1.01% | -- | -- |
| The Goldman Sachs Group, Inc. GS 4.223 05/01/2029 FLT USD Corporate '28 | 0.89% | 99.10 | 0.10% |
|
GOVERNMENT NATIONAL MORTGAGE ASSOCIATION 22177G JA SEQ FIX 5% 20-MAY-2048
|
0.84% | -- | -- |
Fees & Availability
| Fees | |
| Actual 12B-1 Fee | -- |
| Actual Management Fee | 0.60% |
| Administration Fee | -- |
| Maximum Front Load | -- |
| Maximum Deferred Load | -- |
| Maximum Redemption Fee | 0.00% |
| General Availability | |
| Available for Insurance Product | No |
| Available for RRSP | No |
| Purchase Details | |
| Open to New Investors |
|
| Minimum Initial Investment | 500.00 None |
| Minimum Subsequent Investment | 0.00 None |
Basic Info
| Investment Strategy | |
| The Fund seeks to provide a high level of current income consistent with stability of principal and current liquidity by investing in high-grade, short-term debt securities. |
| General | |
| Security Type | Mutual Fund |
| Equity Style | -- |
| Broad Asset Class | Taxable Bond |
| Broad Category | Fixed Income |
| Global Peer Group | Bond USD Short Term |
| Peer Group | Short Investment Grade Debt Funds |
| Global Macro | Bond Short Term |
| US Macro | Short/Intermediate Investment-Grade Funds |
| YCharts Categorization | -- |
| YCharts Benchmark | -- |
| Prospectus Objective | Short Investment Grade Debt Funds |
| Fund Owner Firm Name | Homestead Funds |
| Broad Asset Class Benchmark Index | |
| ^BBUSATR | 100.0% |
Fundamentals
| General | |
| Distribution Yield | -- |
| Dividend Yield TTM (6-8-26) | 3.81% |
| 30-Day SEC Yield (4-30-26) | 3.65% |
| 7-Day SEC Yield | -- |
| Number of Holdings | 244 |
| Bond | |
| Yield to Maturity (3-31-26) | 4.38% |
| Effective Duration | -- |
| Average Coupon | 4.36% |
| Calculated Average Quality | 2.596 |
| Effective Maturity | 6.562 |
| Nominal Maturity | 6.594 |
| Number of Bond Holdings | 241 |
As of March 31, 2026
Fund Details
| Key Dates | |
| Inception Date | 11/5/1991 |
| Last Annual Report Date | 12/31/2025 |
| Last Prospectus Date | 5/1/2026 |
| Attributes | |
| Index Fund | -- |
| Inverse Fund | No |
| Leveraged Fund | -- |
| Fund of Funds | No |
| Currency Hedged Fund | -- |
| Socially Responsible Fund | No |
Top Portfolio Holders
| Name | % Weight |
|---|---|
| Portfolio A | 5.00% |
| Portfolio B | 3.50% |
| Portfolio C | 2.25% |
Excel Add-In Codes
| Name: =YCI("M:HOSBX", "name") |
| Broad Asset Class: =YCI("M:HOSBX", "broad_asset_class") |
| Broad Category: =YCI("M:HOSBX", "broad_category_group") |
| Prospectus Objective: =YCI("M:HOSBX", "prospectus_objective") |
| To find the codes for any of our securities and financial metrics, see our Complete Excel Reference. |