

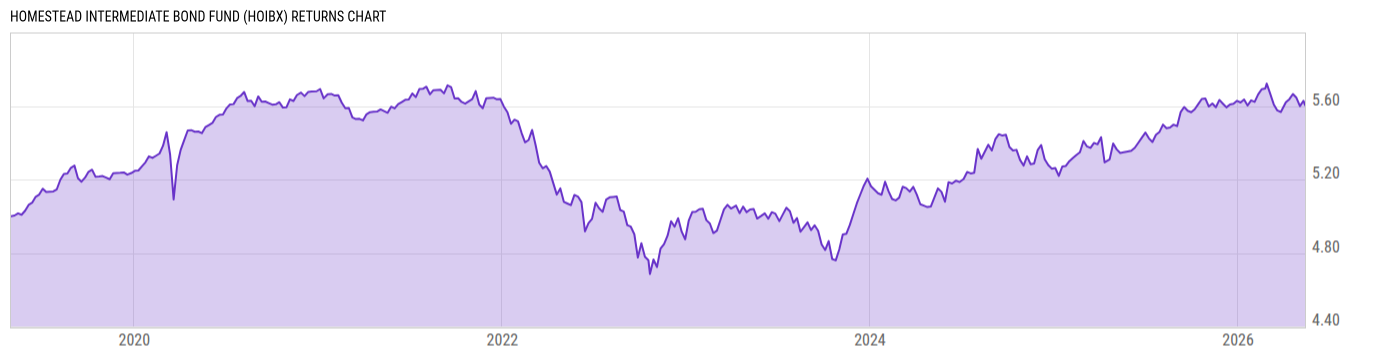
Homestead Intermediate Bond Fund (HOIBX)
4.56
+0.01
(+0.22%)
USD |
Jun 09 2026
Returns Chart
Key Stats
| Net Expense Ratio | Total Assets Under Management | Weighted Average Dividend Yield | Turnover Ratio (Generic) |
|---|---|---|---|
| 0.80% | 149.27M | -- | 183.0% |
| 1 Year Fund Level Flows | 1 Year Total Returns (Daily) | Annualized Total Returns Since Inception (Daily) | Max Drawdown (Since Inception) |
| 4.552M | 4.61% |
Basic Info
| Investment Strategy | |
| The Fund seeks to provide a high level of current income consistent with preservation of capital by investing in bonds and other debt securities. Under normal circumstances, the Fund intends to invest at least 80% of its net assets (plus the amount of borrowings for investment purposes) in fixed-income debt securities. |
| General | |
| Security Type | Mutual Fund |
| Equity Style | -- |
| Broad Asset Class | Taxable Bond |
| Broad Category | Fixed Income |
| Global Peer Group | Bond USD Medium Term |
| Peer Group | Intermediate U.S. Government Funds |
| Global Macro | Bond HC |
| US Macro | Short-/Intermediate-Term U.S. Government & Treasury Funds |
| YCharts Categorization | -- |
| YCharts Benchmark | -- |
| Prospectus Objective | Intermediate U.S. Government Funds |
| Fund Owner Firm Name | Homestead Funds |
| Broad Asset Class Benchmark Index | |
| ^BBUSATR | 100.0% |
Net Fund Flows Versus Peer Group
1 Month
% Rank:
32
-35.16M
Peer Group Low
1.022B
Peer Group High
1 Year
% Rank:
32
4.552M
-332.41M
Peer Group Low
10.07B
Peer Group High
3 Months
% Rank:
27
-56.84M
Peer Group Low
1.902B
Peer Group High
3 Years
% Rank:
38
-2.890B
Peer Group Low
29.25B
Peer Group High
6 Months
% Rank:
25
-100.67M
Peer Group Low
6.374B
Peer Group High
5 Years
% Rank:
25
-4.006B
Peer Group Low
38.24B
Peer Group High
YTD
% Rank:
22
-74.90M
Peer Group Low
5.420B
Peer Group High
10 Years
% Rank:
20
-4.734B
Peer Group Low
48.20B
Peer Group High
Date Unavailable
Risk
Performance Versus Peer Group
Annual Total Returns Versus Peers
As of June 10, 2026.
Asset Allocation
As of March 31, 2026.
| Type | % Net |
|---|---|
| Cash | 1.17% |
| Stock | 0.00% |
| Bond | 98.83% |
| Convertible | 0.00% |
| Preferred | 0.00% |
| Other | 0.00% |
Top 10 Holdings
| Name | % Weight | Price | % Change |
|---|---|---|---|
| United States of America USGB 3.75 02/28/2033 FIX USD Government | 5.39% | 96.39 | 0.22% |
| United States of America USGB 3.5 03/15/2029 FIX USD Government | 4.15% | 98.26 | 0.09% |
| United States of America USGB 3.875 03/31/2031 FIX USD Government | 3.36% | 98.52 | 0.14% |
| United States of America USGB 3.875 03/31/2028 FIX USD Government | 2.89% | 99.56 | 0.06% |
| FHLMC-New 2.0 01/25/2052 FIX USD Agency | 2.89% | 79.65 | 0.10% |
| United States of America USGB 4.625 11/15/2055 FIX USD Government | 2.89% | 94.04 | 0.58% |
| United States of America USGB 4.625 02/15/2046 FIX USD Government | 2.67% | 94.99 | 0.52% |
| United States of America USGB 3.375 08/15/2042 FIX USD Government | 2.41% | 82.61 | 0.46% |
| State Street US Government Money Market Fund Prem | 2.37% | 1.00 | 0.00% |
| United States of America USGB 2.375 02/15/2042 FIX USD Government | 2.36% | 72.11 | 0.47% |
Fees & Availability
| Fees | |
| Actual 12B-1 Fee | -- |
| Actual Management Fee | 0.54% |
| Administration Fee | -- |
| Maximum Front Load | -- |
| Maximum Deferred Load | -- |
| Maximum Redemption Fee | -- |
| General Availability | |
| Available for Insurance Product | No |
| Available for RRSP | No |
| Purchase Details | |
| Open to New Investors |
|
| Minimum Initial Investment | 500.00 None |
| Minimum Subsequent Investment | 0.00 None |
Basic Info
| Investment Strategy | |
| The Fund seeks to provide a high level of current income consistent with preservation of capital by investing in bonds and other debt securities. Under normal circumstances, the Fund intends to invest at least 80% of its net assets (plus the amount of borrowings for investment purposes) in fixed-income debt securities. |
| General | |
| Security Type | Mutual Fund |
| Equity Style | -- |
| Broad Asset Class | Taxable Bond |
| Broad Category | Fixed Income |
| Global Peer Group | Bond USD Medium Term |
| Peer Group | Intermediate U.S. Government Funds |
| Global Macro | Bond HC |
| US Macro | Short-/Intermediate-Term U.S. Government & Treasury Funds |
| YCharts Categorization | -- |
| YCharts Benchmark | -- |
| Prospectus Objective | Intermediate U.S. Government Funds |
| Fund Owner Firm Name | Homestead Funds |
| Broad Asset Class Benchmark Index | |
| ^BBUSATR | 100.0% |
Fundamentals
| General | |
| Distribution Yield | -- |
| Dividend Yield TTM (6-8-26) | 3.70% |
| 30-Day SEC Yield (4-30-26) | 3.70% |
| 7-Day SEC Yield | -- |
| Number of Holdings | 278 |
| Bond | |
| Yield to Maturity (3-31-26) | 4.75% |
| Effective Duration | -- |
| Average Coupon | 4.30% |
| Calculated Average Quality | 2.621 |
| Effective Maturity | 14.34 |
| Nominal Maturity | 14.40 |
| Number of Bond Holdings | 277 |
As of March 31, 2026
Fund Details
| Key Dates | |
| Inception Date | 5/1/2019 |
| Last Annual Report Date | 12/31/2025 |
| Last Prospectus Date | 5/1/2026 |
| Attributes | |
| Index Fund | -- |
| Inverse Fund | No |
| Leveraged Fund | -- |
| Fund of Funds | No |
| Currency Hedged Fund | -- |
| Socially Responsible Fund | No |
Top Portfolio Holders
| Name | % Weight |
|---|---|
| Portfolio A | 5.00% |
| Portfolio B | 3.50% |
| Portfolio C | 2.25% |
Excel Add-In Codes
| Name: =YCI("M:HOIBX", "name") |
| Broad Asset Class: =YCI("M:HOIBX", "broad_asset_class") |
| Broad Category: =YCI("M:HOIBX", "broad_category_group") |
| Prospectus Objective: =YCI("M:HOIBX", "prospectus_objective") |
| To find the codes for any of our securities and financial metrics, see our Complete Excel Reference. |