

Holbrook Income Fund A (HOBAX)
9.76
0.00 (0.00%)
USD |
Jun 09 2026
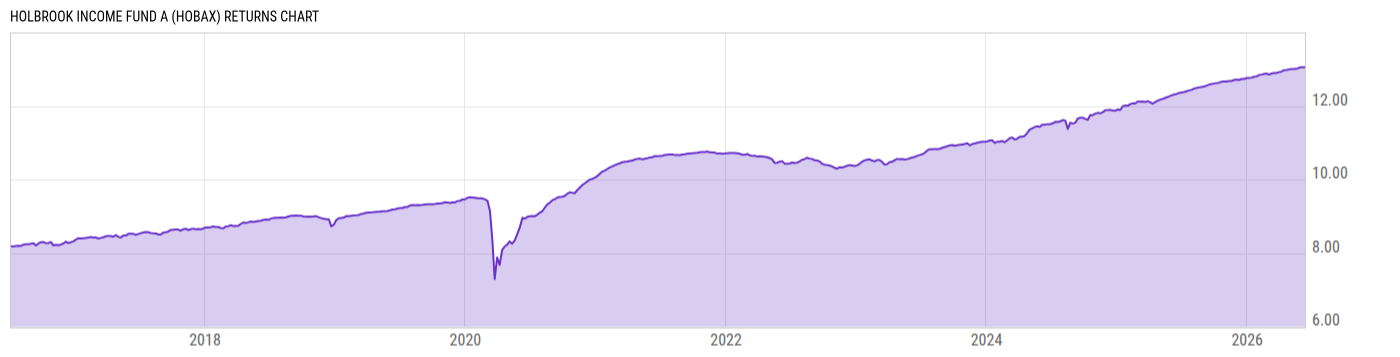
Returns Chart
Key Stats
| Net Expense Ratio | Total Assets Under Management | Weighted Average Dividend Yield | Turnover Ratio (Generic) |
|---|---|---|---|
| 1.31% | 3.920B | -- | 68.00% |
| 1 Year Fund Level Flows | 1 Year Total Returns (Daily) | Annualized Total Returns Since Inception (Daily) | Max Drawdown (Since Inception) |
| 1.404B | 6.01% |
Basic Info
| Investment Strategy | |
| The Fund seeks to provide current income, with a secondary objective of capital preservation in a rising interest rate environment. It will allocate its portfolio in fixed income securities through the purchase of closed end investment companies and exchange-traded funds that invest in income producing securities. |
| General | |
| Security Type | Mutual Fund |
| Equity Style | -- |
| Broad Asset Class | Taxable Bond |
| Broad Category | Fixed Income |
| Global Peer Group | Bond Global USD |
| Peer Group | Flexible Income Funds |
| Global Macro | Bond Global |
| US Macro | General Domestic Taxable Fixed Income Funds |
| YCharts Categorization | -- |
| YCharts Benchmark | -- |
| Prospectus Objective | Flexible Income Funds |
| Fund Owner Firm Name | Holbrook Holdings |
| Broad Asset Class Benchmark Index | |
| ^BBUSATR | 100.0% |
Net Fund Flows Versus Peer Group
1 Month
% Rank:
4
-271.80M
Peer Group Low
249.15M
Peer Group High
1 Year
% Rank:
2
1.404B
-1.145B
Peer Group Low
1.404B
Peer Group High
3 Months
% Rank:
2
-436.34M
Peer Group Low
366.92M
Peer Group High
3 Years
% Rank:
2
-2.320B
Peer Group Low
2.417B
Peer Group High
6 Months
% Rank:
2
-974.90M
Peer Group Low
664.10M
Peer Group High
5 Years
% Rank:
2
-5.849B
Peer Group Low
3.141B
Peer Group High
YTD
% Rank:
2
-651.97M
Peer Group Low
570.91M
Peer Group High
10 Years
% Rank:
3
-11.18B
Peer Group Low
3.681B
Peer Group High
Date Unavailable
Risk
Performance Versus Peer Group
Annual Total Returns Versus Peers
As of June 10, 2026.
Asset Allocation
As of April 30, 2026.
| Type | % Net |
|---|---|
| Cash | 0.89% |
| Stock | 0.39% |
| Bond | 94.64% |
| Convertible | 0.00% |
| Preferred | 1.63% |
| Other | 2.45% |
Top 10 Holdings
| Name | % Weight | Price | % Change |
|---|---|---|---|
| United States of America USGB 1.625 04/15/2030 FIX USD Government | 3.09% | 99.54 | 0.05% |
| United States of America USGB 0.125 01/15/2030 FIX USD Government | 2.97% | 94.61 | 0.06% |
| BRC GROUP HOLDINGS, INC. BRCGR 8.0 01/01/2028 FIX USD Corporate 144A | 2.22% | 97.50 | 0.00% |
| UIRC-GSA INTERNATIONAL, LLC UIRCINT 7.0 03/31/2030 FIX USD Corporate | 2.16% | -- | -- |
| PennantPark Investment Corporation PENNINV 01/02/2029 FIX USD Corporate 144A | 2.04% | -- | -- |
| American Coastal Insurance Corporation AMECOA 6.25 12/15/2027 VAR USD Corporate | 1.88% | 99.33 | 0.15% |
| First American Government Obligations Fd X | 1.86% | 1.00 | 0.00% |
| SBL Holdings, Inc. SBLH 5.9 09/26/2028 FIX USD Corporate 144A | 1.77% | 97.19 | 0.30% |
| Babcock & Wilcox Enterprises, Inc. BABCOWI 8.75 06/30/2030 FIX USD Corporate 144A | 1.65% | 100.38 | 0.00% |
| HORIZON TECHNOLOGY FINANCE CORPORATION HORITEC 7.0 12/15/2028 FIX USD Corporate | 1.56% | 100.25 | 0.00% |
Fees & Availability
| Fees | |
| Actual 12B-1 Fee | 0.25% |
| Actual Management Fee | 0.80% |
| Administration Fee | 38.12K% |
| Maximum Front Load | 1.25% |
| Maximum Deferred Load | -- |
| Maximum Redemption Fee | -- |
| General Availability | |
| Available for Insurance Product | No |
| Available for RRSP | No |
| Purchase Details | |
| Open to New Investors |
|
| Minimum Initial Investment | 2500.00 None |
| Minimum Subsequent Investment | 100.00 None |
Basic Info
| Investment Strategy | |
| The Fund seeks to provide current income, with a secondary objective of capital preservation in a rising interest rate environment. It will allocate its portfolio in fixed income securities through the purchase of closed end investment companies and exchange-traded funds that invest in income producing securities. |
| General | |
| Security Type | Mutual Fund |
| Equity Style | -- |
| Broad Asset Class | Taxable Bond |
| Broad Category | Fixed Income |
| Global Peer Group | Bond Global USD |
| Peer Group | Flexible Income Funds |
| Global Macro | Bond Global |
| US Macro | General Domestic Taxable Fixed Income Funds |
| YCharts Categorization | -- |
| YCharts Benchmark | -- |
| Prospectus Objective | Flexible Income Funds |
| Fund Owner Firm Name | Holbrook Holdings |
| Broad Asset Class Benchmark Index | |
| ^BBUSATR | 100.0% |
Fundamentals
| General | |
| Distribution Yield | -- |
| Dividend Yield TTM (6-8-26) | 6.07% |
| 30-Day SEC Yield (5-31-26) | 6.12% |
| 7-Day SEC Yield | -- |
| Number of Holdings | 297 |
| Bond | |
| Yield to Maturity (4-30-26) | 5.26% |
| Effective Duration | 1.15 |
| Average Coupon | 6.22% |
| Calculated Average Quality | 2.440 |
| Effective Maturity | 4.164 |
| Nominal Maturity | 4.195 |
| Number of Bond Holdings | 282 |
As of April 30, 2026
Fund Details
Top Portfolio Holders
| Name | % Weight |
|---|---|
| Portfolio A | 5.00% |
| Portfolio B | 3.50% |
| Portfolio C | 2.25% |
Excel Add-In Codes
| Name: =YCI("M:HOBAX", "name") |
| Broad Asset Class: =YCI("M:HOBAX", "broad_asset_class") |
| Broad Category: =YCI("M:HOBAX", "broad_category_group") |
| Prospectus Objective: =YCI("M:HOBAX", "prospectus_objective") |
| To find the codes for any of our securities and financial metrics, see our Complete Excel Reference. |