

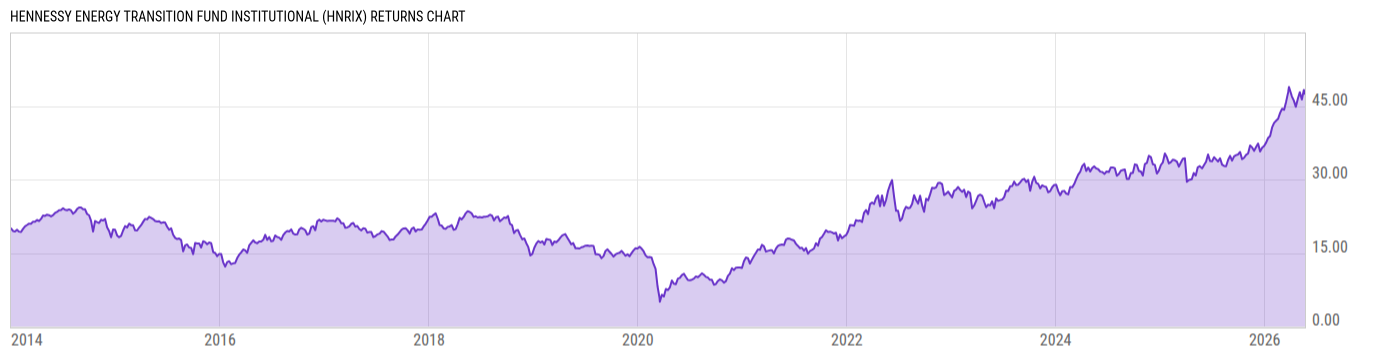
Hennessy Energy Transition Fund Institutional (HNRIX)
39.98
+0.05
(+0.13%)
USD |
May 22 2026
Returns Chart
Key Stats
| Net Expense Ratio | Total Assets Under Management | Weighted Average Dividend Yield | Turnover Ratio (Generic) |
|---|---|---|---|
| 2.20% | 23.64M | 2.19% | 33.00% |
| 1 Year Fund Level Flows | 1 Year Total Returns (Daily) | Annualized Total Returns Since Inception (Daily) | Max Drawdown (Since Inception) |
| 2.482M | 49.11% |
Basic Info
| Investment Strategy | |
| The Fund seeks to provide total return. The Fund invests at least 80% of its net assets in publicly traded equity and debt securities of US energy companies including energy companies, industrial companies, infrastructure companies, and logistics companies. The Fund may invest up to 25% of its total assets in energy MLPs. |
| General | |
| Security Type | Mutual Fund |
| Equity Style | Multi Cap Value |
| Broad Asset Class | Sector Equity |
| Broad Category | Equity |
| Global Peer Group | Equity Theme - Natural Resources |
| Peer Group | Natural Resources Funds |
| Global Macro | Equity Theme |
| US Macro | Sector Equity Funds |
| YCharts Categorization | -- |
| YCharts Benchmark | -- |
| Prospectus Objective | Natural Resources Funds |
| Fund Owner Firm Name | Hennessy Funds |
| Broad Asset Class Benchmark Index | |
| ^MSWNTR | 100.0% |
Net Fund Flows Versus Peer Group
1 Month
% Rank:
33
-1.080B
Peer Group Low
132.78M
Peer Group High
1 Year
% Rank:
60
2.482M
-334.35M
Peer Group Low
1.686B
Peer Group High
3 Months
% Rank:
60
-135.72M
Peer Group Low
2.311B
Peer Group High
3 Years
% Rank:
30
-10.74B
Peer Group Low
607.66M
Peer Group High
6 Months
% Rank:
68
-205.60M
Peer Group Low
4.533B
Peer Group High
5 Years
% Rank:
34
-15.29B
Peer Group Low
607.66M
Peer Group High
YTD
% Rank:
70
-137.66M
Peer Group Low
4.974B
Peer Group High
10 Years
% Rank:
61
-8.068B
Peer Group Low
612.47M
Peer Group High
Date Unavailable
Risk
Performance Versus Peer Group
Annual Total Returns Versus Peers
As of May 26, 2026.
Asset Allocation
As of March 31, 2026.
| Type | % Net |
|---|---|
| Cash | 1.75% |
| Stock | 94.01% |
| Bond | 1.45% |
| Convertible | 0.00% |
| Preferred | 0.00% |
| Other | 2.79% |
Top 10 Holdings
| Name | % Weight | Price | % Change |
|---|---|---|---|
| Exxon Mobil Corp. | 5.76% | 154.02 | -0.58% |
| ConocoPhillips | 4.77% | 119.62 | -0.70% |
| Diamondback Energy, Inc. | 4.72% | 200.42 | -0.14% |
| EOG Resources, Inc. | 4.56% | 140.76 | -0.33% |
| Chevron Corp. | 4.53% | 189.90 | -0.80% |
| Halliburton Co. | 4.50% | 41.36 | -0.27% |
| NextEra Energy, Inc. | 4.36% | 88.28 | -0.31% |
| Freeport-McMoRan, Inc. | 4.24% | 64.55 | 4.13% |
| SLB Ltd. | 4.19% | 58.20 | 1.61% |
| Helmerich & Payne, Inc. | 4.16% | 40.55 | 1.68% |
Fees & Availability
| Fees | |
| Actual 12B-1 Fee | -- |
| Actual Management Fee | 1.08% |
| Administration Fee | 14.20K% |
| Maximum Front Load | -- |
| Maximum Deferred Load | -- |
| Maximum Redemption Fee | -- |
| General Availability | |
| Available for Insurance Product | No |
| Available for RRSP | No |
| Purchase Details | |
| Open to New Investors |
|
| Minimum Initial Investment | 250000.0 None |
| Minimum Subsequent Investment | 0.00 None |
Basic Info
| Investment Strategy | |
| The Fund seeks to provide total return. The Fund invests at least 80% of its net assets in publicly traded equity and debt securities of US energy companies including energy companies, industrial companies, infrastructure companies, and logistics companies. The Fund may invest up to 25% of its total assets in energy MLPs. |
| General | |
| Security Type | Mutual Fund |
| Equity Style | Multi Cap Value |
| Broad Asset Class | Sector Equity |
| Broad Category | Equity |
| Global Peer Group | Equity Theme - Natural Resources |
| Peer Group | Natural Resources Funds |
| Global Macro | Equity Theme |
| US Macro | Sector Equity Funds |
| YCharts Categorization | -- |
| YCharts Benchmark | -- |
| Prospectus Objective | Natural Resources Funds |
| Fund Owner Firm Name | Hennessy Funds |
| Broad Asset Class Benchmark Index | |
| ^MSWNTR | 100.0% |
Fundamentals
| General | |
| Distribution Yield | -- |
| Dividend Yield TTM (5-21-26) | 0.60% |
| 30-Day SEC Yield (4-30-26) | 0.00% |
| 7-Day SEC Yield | -- |
| Number of Holdings | 30 |
| Stock | |
| Weighted Average PE Ratio | 24.35 |
| Weighted Average Price to Sales Ratio | 2.683 |
| Weighted Average Price to Book Ratio | 2.833 |
| Weighted Median ROE | 11.83% |
| Weighted Median ROA | 5.38% |
| ROI (TTM) | 6.21% |
| Return on Investment (TTM) | 6.21% |
| Earning Yield | 0.0475 |
| LT Debt / Shareholders Equity | 0.5379 |
| Number of Equity Holdings | 27 |
As of March 31, 2026
Growth Metrics
| EPS Growth (1Y) | 8.30% |
| EPS Growth (3Y) | -10.70% |
| EPS Growth (5Y) | 23.51% |
| Sales Growth (1Y) | 12.49% |
| Sales Growth (3Y) | -1.18% |
| Sales Growth (5Y) | 16.48% |
| Sales per Share Growth (1Y) | 9.85% |
| Sales per Share Growth (3Y) | -2.33% |
| Operating Cash Flow - Growth Rate (3Y) | 1.21% |
As of March 31, 2026
Fund Details
| Key Dates | |
| Inception Date | 12/31/2013 |
| Last Annual Report Date | 10/31/2025 |
| Last Prospectus Date | 2/28/2025 |
| Share Classes | |
| HNRGX | Inv |
| Attributes | |
| Index Fund | -- |
| Inverse Fund | No |
| Leveraged Fund | -- |
| Fund of Funds | No |
| Currency Hedged Fund | -- |
| Socially Responsible Fund | No |
Top Portfolio Holders
| Name | % Weight |
|---|---|
| Portfolio A | 5.00% |
| Portfolio B | 3.50% |
| Portfolio C | 2.25% |
Excel Add-In Codes
| Name: =YCI("M:HNRIX", "name") |
| Broad Asset Class: =YCI("M:HNRIX", "broad_asset_class") |
| Broad Category: =YCI("M:HNRIX", "broad_category_group") |
| Prospectus Objective: =YCI("M:HNRIX", "prospectus_objective") |
| To find the codes for any of our securities and financial metrics, see our Complete Excel Reference. |