

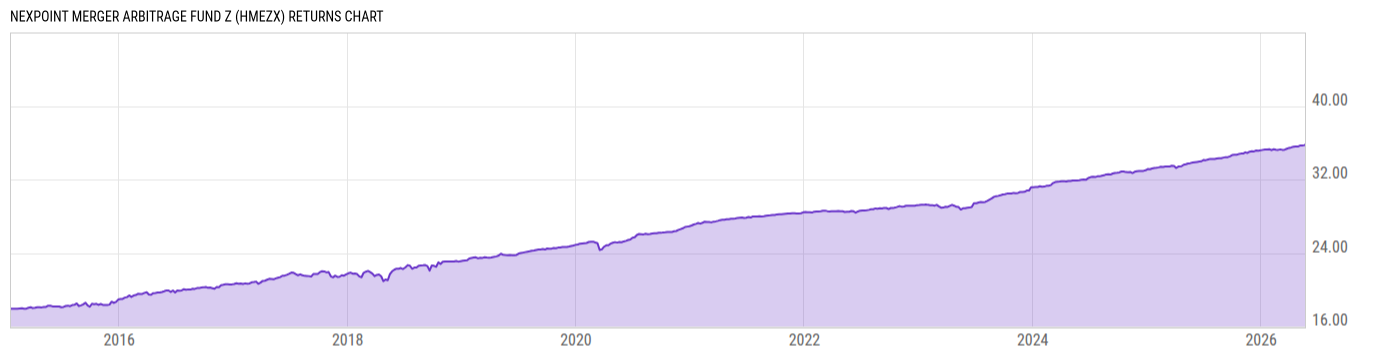
NexPoint Merger Arbitrage Fund Z (HMEZX)
20.06
+0.01
(+0.05%)
USD |
Jun 09 2026
Returns Chart
Key Stats
| Net Expense Ratio | Total Assets Under Management | Weighted Average Dividend Yield | Turnover Ratio (Generic) |
|---|---|---|---|
| 1.90% | 1.454B | -- | 406.0% |
| 1 Year Fund Level Flows | 1 Year Total Returns (Daily) | Annualized Total Returns Since Inception (Daily) | Max Drawdown (Since Inception) |
| 283.95M | 5.54% |
Basic Info
| Investment Strategy | |
| The Fund seeks to generate positive absolute returns. The Fund seeks to achieve its investment objective by investing at least 80% of its total assets in securities of companies that are involved in publicly-announced mergers or companies that the Adviser believes may be involved in Merger Transactions.. |
| General | |
| Security Type | Mutual Fund |
| Equity Style | -- |
| Broad Asset Class | Alternative |
| Broad Category | Alternative Strategies |
| Global Peer Group | Alternative Event Driven |
| Peer Group | Alternative Event Driven Funds |
| Global Macro | Alternative Equity |
| US Macro | Alternative Equity Funds |
| YCharts Categorization | -- |
| YCharts Benchmark | -- |
| Prospectus Objective | Alternative Event Driven Funds |
| Fund Owner Firm Name | NexPoint |
| Broad Asset Class Benchmark Index | |
| ^MSACWINTR | 100.0% |
Net Fund Flows Versus Peer Group
1 Month
% Rank:
5
-38.52M
Peer Group Low
44.34M
Peer Group High
1 Year
% Rank:
7
283.95M
-48.90M
Peer Group Low
592.89M
Peer Group High
3 Months
% Rank:
5
-174.16M
Peer Group Low
93.86M
Peer Group High
3 Years
% Rank:
7
-3.236B
Peer Group Low
592.89M
Peer Group High
6 Months
% Rank:
7
-66.22M
Peer Group Low
319.78M
Peer Group High
5 Years
% Rank:
5
-3.966B
Peer Group Low
1.046B
Peer Group High
YTD
% Rank:
7
-25.09M
Peer Group Low
292.47M
Peer Group High
10 Years
% Rank:
11
-2.700B
Peer Group Low
3.147B
Peer Group High
Date Unavailable
Risk
Performance Versus Peer Group
Annual Total Returns Versus Peers
As of June 10, 2026.
Asset Allocation
As of December 31, 2025.
| Type | % Net |
|---|---|
| Cash | 11.76% |
| Stock | 78.01% |
| Bond | 11.26% |
| Convertible | 0.00% |
| Preferred | 0.00% |
| Other | -1.03% |
Top 10 Holdings
| Name | % Weight | Price | % Change |
|---|---|---|---|
|
Cash and Cash Equivalents
|
11.61% | -- | -- |
| Dayforce, Inc. | 7.83% | 69.86 | 0.00% |
|
Cyberark Software Ltd ORD
|
6.24% | -- | -- |
|
Avidity Biosciences Inc ORD
|
4.90% | -- | -- |
|
Cidara Therapeutics Inc ORD
|
4.90% | -- | -- |
| Sealed Air Corp. (DELISTED) | 4.88% | 42.15 | 0.00% |
| Hologic, Inc. (DELISTED) | 4.83% | 76.01 | 0.00% |
|
Hillenbrand Inc ORD
|
4.81% | -- | -- |
| InterRent Real Estate Investment Trust | 4.15% | 12.78 | 0.31% |
| EXACT Sciences Corp. (DELISTED) | 3.91% | 104.91 | 0.00% |
Fees & Availability
| Fees | |
| Actual 12B-1 Fee | -- |
| Actual Management Fee | 0.80% |
| Administration Fee | 1.62M% |
| Maximum Front Load | -- |
| Maximum Deferred Load | -- |
| Maximum Redemption Fee | -- |
| General Availability | |
| Available for Insurance Product | No |
| Available for RRSP | No |
| Purchase Details | |
| Open to New Investors |
|
| Minimum Initial Investment | 2500.00 None |
| Minimum Subsequent Investment | 50.00 None |
Basic Info
| Investment Strategy | |
| The Fund seeks to generate positive absolute returns. The Fund seeks to achieve its investment objective by investing at least 80% of its total assets in securities of companies that are involved in publicly-announced mergers or companies that the Adviser believes may be involved in Merger Transactions.. |
| General | |
| Security Type | Mutual Fund |
| Equity Style | -- |
| Broad Asset Class | Alternative |
| Broad Category | Alternative Strategies |
| Global Peer Group | Alternative Event Driven |
| Peer Group | Alternative Event Driven Funds |
| Global Macro | Alternative Equity |
| US Macro | Alternative Equity Funds |
| YCharts Categorization | -- |
| YCharts Benchmark | -- |
| Prospectus Objective | Alternative Event Driven Funds |
| Fund Owner Firm Name | NexPoint |
| Broad Asset Class Benchmark Index | |
| ^MSACWINTR | 100.0% |
Fundamentals
| General | |
| Distribution Yield | -- |
| Dividend Yield TTM (6-8-26) | 4.84% |
| 30-Day SEC Yield | -- |
| 7-Day SEC Yield | -- |
| Number of Holdings | 64 |
| Stock | |
| Weighted Average PE Ratio | 32.04 |
| Weighted Average Price to Sales Ratio | 8.420 |
| Weighted Average Price to Book Ratio | 5.011 |
| Weighted Median ROE | -3.75% |
| Weighted Median ROA | -4.67% |
| ROI (TTM) | -4.80% |
| Return on Investment (TTM) | -4.80% |
| Earning Yield | 0.0574 |
| LT Debt / Shareholders Equity | 1.279 |
| Number of Equity Holdings | 45 |
| Bond | |
| Yield to Maturity (12-31-25) | 3.12% |
| Effective Duration | -- |
| Average Coupon | 8.47% |
| Calculated Average Quality | 5.214 |
| Effective Maturity | 4.583 |
| Nominal Maturity | 4.583 |
| Number of Bond Holdings | 10 |
As of December 31, 2025
Growth Metrics
| EPS Growth (1Y) | 8.49% |
| EPS Growth (3Y) | -6.84% |
| EPS Growth (5Y) | 7.44% |
| Sales Growth (1Y) | 6.52% |
| Sales Growth (3Y) | 8.39% |
| Sales Growth (5Y) | 10.71% |
| Sales per Share Growth (1Y) | 0.00% |
| Sales per Share Growth (3Y) | 3.72% |
| Operating Cash Flow - Growth Rate (3Y) | 22.02% |
As of December 31, 2025
Top Portfolio Holders
| Name | % Weight |
|---|---|
| Portfolio A | 5.00% |
| Portfolio B | 3.50% |
| Portfolio C | 2.25% |
Excel Add-In Codes
| Name: =YCI("M:HMEZX", "name") |
| Broad Asset Class: =YCI("M:HMEZX", "broad_asset_class") |
| Broad Category: =YCI("M:HMEZX", "broad_category_group") |
| Prospectus Objective: =YCI("M:HMEZX", "prospectus_objective") |
| To find the codes for any of our securities and financial metrics, see our Complete Excel Reference. |