

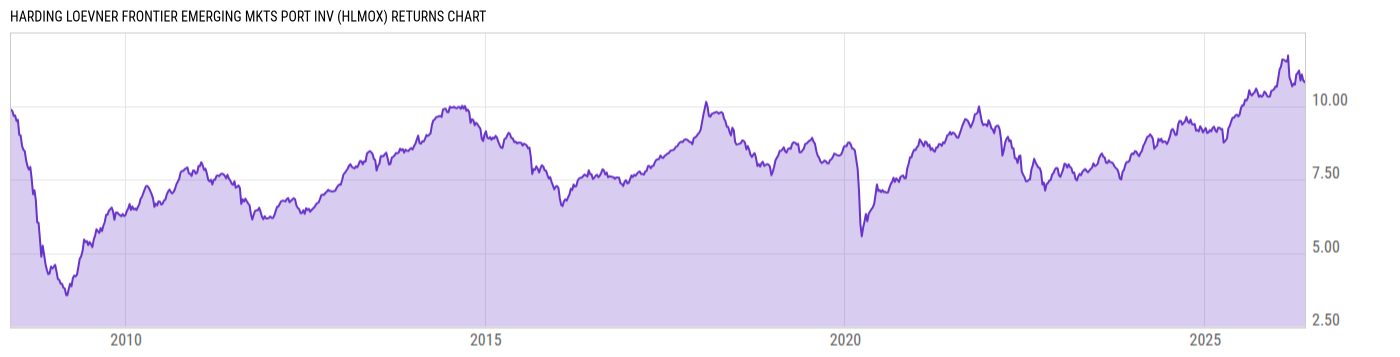
Harding Loevner Frontier Emerging Mkts Port Inv (HLMOX)
9.02
+0.07
(+0.78%)
USD |
Jun 09 2026
Returns Chart
Key Stats
| Net Expense Ratio | Total Assets Under Management | Weighted Average Dividend Yield | Turnover Ratio (Generic) |
|---|---|---|---|
| 1.75% | 115.68M | 2.53% | 29.00% |
| 1 Year Fund Level Flows | 1 Year Total Returns (Daily) | Annualized Total Returns Since Inception (Daily) | Max Drawdown (Since Inception) |
| -29.40M | 11.45% |
Basic Info
| Investment Strategy | |
| The Portfolio seeks long term capital appreciation through investments in equity securities of companies based in frontier and smaller emerging markets. The Fund invests primarily in equity securities of companies that are based in frontier emerging markets, including the smaller traditionally-recognized emerging markets. |
| General | |
| Security Type | Mutual Fund |
| Equity Style | Multi Cap Core |
| Broad Asset Class | International Equity |
| Broad Category | Equity |
| Global Peer Group | Equity Frontier Markets |
| Peer Group | Frontier Markets Funds |
| Global Macro | Equity Emerging Markets |
| US Macro | Emerging Markets Equity Funds |
| YCharts Categorization | -- |
| YCharts Benchmark | -- |
| Prospectus Objective | Frontier Markets Funds |
| Fund Owner Firm Name | Harding Loevner |
| Broad Asset Class Benchmark Index | |
| ^MSACXUSNTR | 100.0% |
Net Fund Flows Versus Peer Group
1 Month
% Rank:
43
-1.736M
Peer Group Low
79.60M
Peer Group High
1 Year
% Rank:
93
-29.40M
-29.40M
Peer Group Low
1.179B
Peer Group High
3 Months
% Rank:
65
-60.58M
Peer Group Low
212.84M
Peer Group High
3 Years
% Rank:
86
-141.32M
Peer Group Low
2.442B
Peer Group High
6 Months
% Rank:
93
-19.74M
Peer Group Low
611.17M
Peer Group High
5 Years
% Rank:
93
-146.02M
Peer Group Low
2.504B
Peer Group High
YTD
% Rank:
43
-24.54M
Peer Group Low
524.09M
Peer Group High
10 Years
% Rank:
79
-822.26M
Peer Group Low
2.500B
Peer Group High
Date Unavailable
Risk
Performance Versus Peer Group
Annual Total Returns Versus Peers
As of June 10, 2026.
Asset Allocation
As of April 30, 2026.
| Type | % Net |
|---|---|
| Cash | 2.44% |
| Stock | 95.18% |
| Bond | 2.38% |
| Convertible | 0.00% |
| Preferred | 0.00% |
| Other | 0.00% |
Top 10 Holdings
| Name | % Weight | Price | % Change |
|---|---|---|---|
| Northern Treasury Portfolio Premier | 4.57% | 1.00 | 0.00% |
| Credicorp Ltd. | 4.44% | 349.61 | 9.29% |
| International Container Terminal Services, Inc. | 4.42% | 14.68 | 0.00% |
|
Mobile World Investment Corp ORD
|
4.34% | -- | -- |
|
Banca Transilvania SA ORD
|
4.27% | -- | -- |
|
Societe d'Exploitation des Ports SA ORD
|
3.88% | -- | -- |
|
JOINT STOCK COMPANY NATIONAL GDR
|
3.81% | -- | -- |
| Grupo Cibest SA | 3.66% | 74.90 | 4.32% |
|
Hoa Phat Group JSC ORD
|
3.60% | -- | -- |
| Kaspi.kz JSC | 3.48% | 78.10 | -2.58% |
Fees & Availability
| Fees | |
| Actual 12B-1 Fee | 0.25% |
| Actual Management Fee | 1.02% |
| Administration Fee | 1.35K% |
| Maximum Front Load | -- |
| Maximum Deferred Load | -- |
| Maximum Redemption Fee | 0.00% |
| General Availability | |
| Available for Insurance Product | No |
| Available for RRSP | No |
| Purchase Details | |
| Open to New Investors |
|
| Minimum Initial Investment | 5000.00 None |
| Minimum Subsequent Investment | 0.00 None |
Basic Info
| Investment Strategy | |
| The Portfolio seeks long term capital appreciation through investments in equity securities of companies based in frontier and smaller emerging markets. The Fund invests primarily in equity securities of companies that are based in frontier emerging markets, including the smaller traditionally-recognized emerging markets. |
| General | |
| Security Type | Mutual Fund |
| Equity Style | Multi Cap Core |
| Broad Asset Class | International Equity |
| Broad Category | Equity |
| Global Peer Group | Equity Frontier Markets |
| Peer Group | Frontier Markets Funds |
| Global Macro | Equity Emerging Markets |
| US Macro | Emerging Markets Equity Funds |
| YCharts Categorization | -- |
| YCharts Benchmark | -- |
| Prospectus Objective | Frontier Markets Funds |
| Fund Owner Firm Name | Harding Loevner |
| Broad Asset Class Benchmark Index | |
| ^MSACXUSNTR | 100.0% |
Fundamentals
| General | |
| Distribution Yield | -- |
| Dividend Yield TTM (6-8-26) | 3.23% |
| 30-Day SEC Yield | -- |
| 7-Day SEC Yield | -- |
| Number of Holdings | 57 |
| Stock | |
| Weighted Average PE Ratio | 19.75 |
| Weighted Average Price to Sales Ratio | 3.931 |
| Weighted Average Price to Book Ratio | 4.735 |
| Weighted Median ROE | 25.62% |
| Weighted Median ROA | 8.94% |
| ROI (TTM) | 19.57% |
| Return on Investment (TTM) | 19.57% |
| Earning Yield | 0.0733 |
| LT Debt / Shareholders Equity | 1.080 |
| Number of Equity Holdings | 54 |
As of April 30, 2026
Growth Metrics
| EPS Growth (1Y) | 26.22% |
| EPS Growth (3Y) | 16.02% |
| EPS Growth (5Y) | 30.69% |
| Sales Growth (1Y) | 11.28% |
| Sales Growth (3Y) | 13.48% |
| Sales Growth (5Y) | 15.23% |
| Sales per Share Growth (1Y) | 11.41% |
| Sales per Share Growth (3Y) | 15.26% |
| Operating Cash Flow - Growth Rate (3Y) | 19.94% |
As of April 30, 2026
Fund Details
Top Portfolio Holders
| Name | % Weight |
|---|---|
| Portfolio A | 5.00% |
| Portfolio B | 3.50% |
| Portfolio C | 2.25% |
Excel Add-In Codes
| Name: =YCI("M:HLMOX", "name") |
| Broad Asset Class: =YCI("M:HLMOX", "broad_asset_class") |
| Broad Category: =YCI("M:HLMOX", "broad_category_group") |
| Prospectus Objective: =YCI("M:HLMOX", "prospectus_objective") |
| To find the codes for any of our securities and financial metrics, see our Complete Excel Reference. |