

Harding Loevner Global Equity Portfolio Inst Cl Z (HLGZX)
33.22
+0.13
(+0.39%)
USD |
May 29 2026
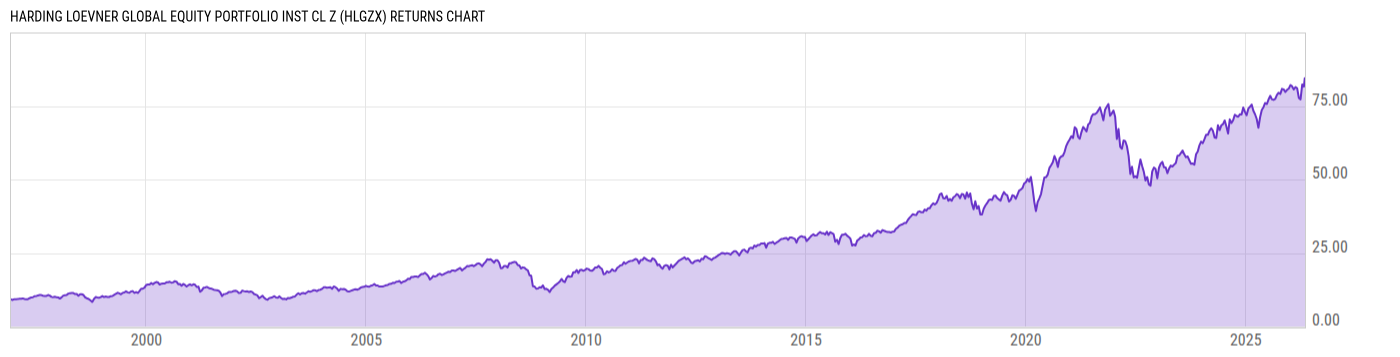
Returns Chart
Key Stats
| Net Expense Ratio | Total Assets Under Management | Weighted Average Dividend Yield | Turnover Ratio (Generic) |
|---|---|---|---|
| 0.76% | 543.22M | 1.10% | 30.00% |
| 1 Year Fund Level Flows | 1 Year Total Returns (Daily) | Annualized Total Returns Since Inception (Daily) | Max Drawdown (Since Inception) |
| -81.60M | 13.71% |
Basic Info
| Investment Strategy | |
| The Fund seeks long-term capital appreciation through investments in equity securities of companies based both in and outside the U.S.. The Fund seeks to identify companies that are well managed, financially sound, fast growing and strongly competitive, and whose shares are under-priced relative to their intrinsic value. |
| General | |
| Security Type | Mutual Fund |
| Equity Style | Large Cap Core |
| Broad Asset Class | International Equity |
| Broad Category | Equity |
| Global Peer Group | Equity Global |
| Peer Group | Global Large-Cap Growth |
| Global Macro | Equity Global |
| US Macro | Developed Global Markets Funds |
| YCharts Categorization | -- |
| YCharts Benchmark | -- |
| Prospectus Objective | Global Funds |
| Fund Owner Firm Name | Harding Loevner |
| Broad Asset Class Benchmark Index | |
| ^MSACXUSNTR | 100.0% |
Net Fund Flows Versus Peer Group
1 Month
% Rank:
62
-670.06M
Peer Group Low
210.80M
Peer Group High
1 Year
% Rank:
55
-81.60M
-8.440B
Peer Group Low
5.269B
Peer Group High
3 Months
% Rank:
55
-1.182B
Peer Group Low
658.44M
Peer Group High
3 Years
% Rank:
80
-18.74B
Peer Group Low
6.112B
Peer Group High
6 Months
% Rank:
58
-4.716B
Peer Group Low
1.590B
Peer Group High
5 Years
% Rank:
79
-28.09B
Peer Group Low
7.672B
Peer Group High
YTD
% Rank:
52
-2.197B
Peer Group Low
1.472B
Peer Group High
10 Years
% Rank:
79
-28.76B
Peer Group Low
7.672B
Peer Group High
Date Unavailable
Risk
Performance Versus Peer Group
Annual Total Returns Versus Peers
As of May 31, 2026.
Asset Allocation
As of April 30, 2026.
| Type | % Net |
|---|---|
| Cash | 0.58% |
| Stock | 99.00% |
| Bond | 0.42% |
| Convertible | 0.00% |
| Preferred | 0.00% |
| Other | 0.00% |
Top 10 Holdings
| Name | % Weight | Price | % Change |
|---|---|---|---|
| Alphabet, Inc. | 5.10% | 380.34 | -2.51% |
| Amazon.com, Inc. | 4.29% | 270.64 | -1.23% |
| NVIDIA Corp. | 3.62% | 211.14 | -1.45% |
| Taiwan Semiconductor Manufacturing Co., Ltd. | 3.52% | 418.45 | -1.51% |
| Schneider Electric SE | 3.33% | 313.28 | 0.93% |
| Microsoft Corp. | 3.16% | 450.24 | 5.45% |
|
SAMSUNG ELECTR GDR
|
3.15% | -- | -- |
| Meta Platforms, Inc. | 2.73% | 632.51 | -0.44% |
| ASML Holding NV | 2.69% | 1623.59 | 1.20% |
| Netflix, Inc. | 2.64% | 86.02 | -0.39% |
Fees & Availability
| Fees | |
| Actual 12B-1 Fee | -- |
| Actual Management Fee | 0.67% |
| Administration Fee | 44.02K% |
| Maximum Front Load | -- |
| Maximum Deferred Load | -- |
| Maximum Redemption Fee | 2.00% |
| General Availability | |
| Available for Insurance Product | No |
| Available for RRSP | No |
| Purchase Details | |
| Open to New Investors |
|
| Minimum Initial Investment | 10.00M None |
| Minimum Subsequent Investment | 0.00 None |
Basic Info
| Investment Strategy | |
| The Fund seeks long-term capital appreciation through investments in equity securities of companies based both in and outside the U.S.. The Fund seeks to identify companies that are well managed, financially sound, fast growing and strongly competitive, and whose shares are under-priced relative to their intrinsic value. |
| General | |
| Security Type | Mutual Fund |
| Equity Style | Large Cap Core |
| Broad Asset Class | International Equity |
| Broad Category | Equity |
| Global Peer Group | Equity Global |
| Peer Group | Global Large-Cap Growth |
| Global Macro | Equity Global |
| US Macro | Developed Global Markets Funds |
| YCharts Categorization | -- |
| YCharts Benchmark | -- |
| Prospectus Objective | Global Funds |
| Fund Owner Firm Name | Harding Loevner |
| Broad Asset Class Benchmark Index | |
| ^MSACXUSNTR | 100.0% |
Fundamentals
| General | |
| Distribution Yield | -- |
| Dividend Yield TTM (5-28-26) | 0.70% |
| 30-Day SEC Yield | -- |
| 7-Day SEC Yield | -- |
| Number of Holdings | 10 |
| Stock | |
| Weighted Average PE Ratio | 30.23 |
| Weighted Average Price to Sales Ratio | 7.999 |
| Weighted Average Price to Book Ratio | 8.211 |
| Weighted Median ROE | 104.2% |
| Weighted Median ROA | 15.29% |
| ROI (TTM) | 21.96% |
| Return on Investment (TTM) | 21.96% |
| Earning Yield | 0.0400 |
| LT Debt / Shareholders Equity | 0.4594 |
| Number of Equity Holdings | 10 |
As of April 30, 2026
Growth Metrics
| EPS Growth (1Y) | 32.00% |
| EPS Growth (3Y) | 20.61% |
| EPS Growth (5Y) | 23.12% |
| Sales Growth (1Y) | 13.55% |
| Sales Growth (3Y) | 14.05% |
| Sales Growth (5Y) | 14.57% |
| Sales per Share Growth (1Y) | 14.72% |
| Sales per Share Growth (3Y) | 13.25% |
| Operating Cash Flow - Growth Rate (3Y) | 21.73% |
As of April 30, 2026
Fund Details
Top Portfolio Holders
| Name | % Weight |
|---|---|
| Portfolio A | 5.00% |
| Portfolio B | 3.50% |
| Portfolio C | 2.25% |
Excel Add-In Codes
| Name: =YCI("M:HLGZX", "name") |
| Broad Asset Class: =YCI("M:HLGZX", "broad_asset_class") |
| Broad Category: =YCI("M:HLGZX", "broad_category_group") |
| Prospectus Objective: =YCI("M:HLGZX", "prospectus_objective") |
| To find the codes for any of our securities and financial metrics, see our Complete Excel Reference. |