

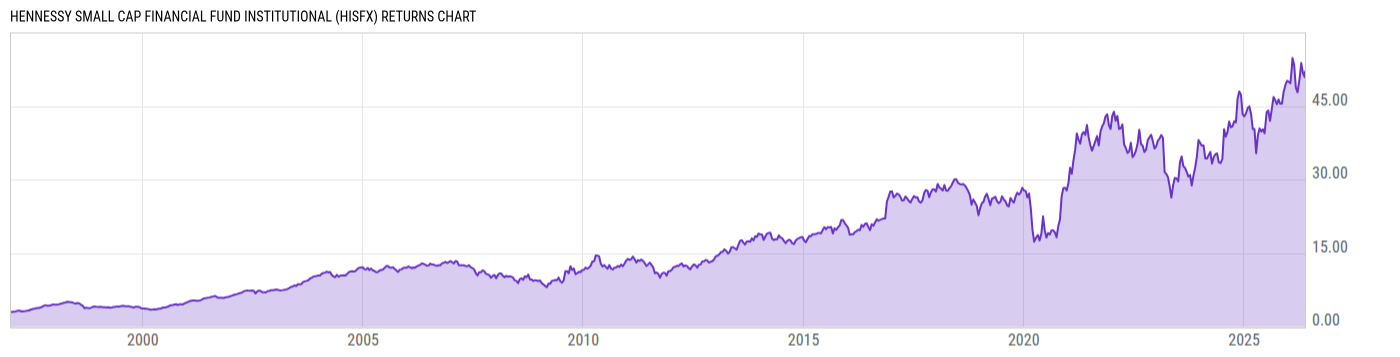
Hennessy Small Cap Financial Fund Institutional (HISFX)
16.86
+0.15
(+0.90%)
USD |
Jun 10 2026
Returns Chart
Key Stats
| Net Expense Ratio | Total Assets Under Management | Weighted Average Dividend Yield | Turnover Ratio (Generic) |
|---|---|---|---|
| 1.33% | 73.78M | 2.42% | 35.00% |
| 1 Year Fund Level Flows | 1 Year Total Returns (Daily) | Annualized Total Returns Since Inception (Daily) | Max Drawdown (Since Inception) |
| -11.18M | 30.99% |
Basic Info
| Investment Strategy | |
| The Fund seeks capital appreciation. Under normal circumstances, the Fund invests at least 80% of its net assets, plus the amount of any borrowings for investment purposes, in securities(consist primarily of common stocks) of small-cap companies principally engaged in the business of providing financial services. |
| General | |
| Security Type | Mutual Fund |
| Equity Style | Small Cap Value |
| Broad Asset Class | Sector Equity |
| Broad Category | Equity |
| Global Peer Group | Equity Sector Financials |
| Peer Group | Financial Services Funds |
| Global Macro | Equity Industry Sector |
| US Macro | Sector Equity Funds |
| YCharts Categorization | -- |
| YCharts Benchmark | -- |
| Prospectus Objective | Financial Services Funds |
| Fund Owner Firm Name | Hennessy Funds |
| Broad Asset Class Benchmark Index | |
| ^MSWNTR | 100.0% |
Net Fund Flows Versus Peer Group
1 Month
% Rank:
34
-1.155B
Peer Group Low
134.43M
Peer Group High
1 Year
% Rank:
33
-11.18M
-1.292B
Peer Group Low
202.72M
Peer Group High
3 Months
% Rank:
30
-735.00M
Peer Group Low
86.31M
Peer Group High
3 Years
% Rank:
47
-690.51M
Peer Group Low
1.877B
Peer Group High
6 Months
% Rank:
38
-1.126B
Peer Group Low
129.49M
Peer Group High
5 Years
% Rank:
57
-8.849B
Peer Group Low
1.605B
Peer Group High
YTD
% Rank:
39
-1.089B
Peer Group Low
82.88M
Peer Group High
10 Years
% Rank:
73
-2.931B
Peer Group Low
2.952B
Peer Group High
Date Unavailable
Risk
Performance Versus Peer Group
Annual Total Returns Versus Peers
As of June 11, 2026.
Asset Allocation
As of March 31, 2026.
| Type | % Net |
|---|---|
| Cash | 0.73% |
| Stock | 98.73% |
| Bond | 0.61% |
| Convertible | 0.00% |
| Preferred | 0.00% |
| Other | -0.07% |
Top 10 Holdings
| Name | % Weight | Price | % Change |
|---|---|---|---|
| ConnectOne Bancorp, Inc. | 5.60% | 32.27 | 1.00% |
| Provident Financial Services, Inc. | 5.50% | 23.25 | 0.56% |
| NB Bancorp, Inc. | 5.48% | 20.42 | -0.41% |
| Hingham Institution for Savings | 5.37% | 292.36 | 1.01% |
| Eagle Bancorp, Inc. (Maryland) | 5.21% | 28.25 | 1.11% |
| OceanFirst Financial Corp. | 5.08% | 18.40 | 0.63% |
| WaFd, Inc. | 4.99% | 36.56 | 0.03% |
| Banc of California, Inc. | 4.95% | 19.87 | 1.12% |
| Beacon Financial Corp. | 4.81% | 30.10 | 1.43% |
| Avidia Bancorp, Inc. | 4.40% | 20.34 | 1.35% |
Fees & Availability
| Fees | |
| Actual 12B-1 Fee | -- |
| Actual Management Fee | 0.90% |
| Administration Fee | 6.61K% |
| Maximum Front Load | -- |
| Maximum Deferred Load | -- |
| Maximum Redemption Fee | 0.00% |
| General Availability | |
| Available for Insurance Product | No |
| Available for RRSP | No |
| Purchase Details | |
| Open to New Investors |
|
| Minimum Initial Investment | 250000.0 None |
| Minimum Subsequent Investment | 0.00 None |
Basic Info
| Investment Strategy | |
| The Fund seeks capital appreciation. Under normal circumstances, the Fund invests at least 80% of its net assets, plus the amount of any borrowings for investment purposes, in securities(consist primarily of common stocks) of small-cap companies principally engaged in the business of providing financial services. |
| General | |
| Security Type | Mutual Fund |
| Equity Style | Small Cap Value |
| Broad Asset Class | Sector Equity |
| Broad Category | Equity |
| Global Peer Group | Equity Sector Financials |
| Peer Group | Financial Services Funds |
| Global Macro | Equity Industry Sector |
| US Macro | Sector Equity Funds |
| YCharts Categorization | -- |
| YCharts Benchmark | -- |
| Prospectus Objective | Financial Services Funds |
| Fund Owner Firm Name | Hennessy Funds |
| Broad Asset Class Benchmark Index | |
| ^MSWNTR | 100.0% |
Fundamentals
| General | |
| Distribution Yield | -- |
| Dividend Yield TTM (6-10-26) | 2.11% |
| 30-Day SEC Yield (5-31-26) | 1.13% |
| 7-Day SEC Yield | -- |
| Number of Holdings | 28 |
| Stock | |
| Weighted Average PE Ratio | 14.46 |
| Weighted Average Price to Sales Ratio | 3.519 |
| Weighted Average Price to Book Ratio | 1.063 |
| Weighted Median ROE | 7.42% |
| Weighted Median ROA | 0.80% |
| ROI (TTM) | 7.42% |
| Return on Investment (TTM) | 7.42% |
| Earning Yield | 0.0782 |
| LT Debt / Shareholders Equity | 0.4588 |
| Number of Equity Holdings | 26 |
As of March 31, 2026
Growth Metrics
| EPS Growth (1Y) | 29.28% |
| EPS Growth (3Y) | -1.29% |
| EPS Growth (5Y) | 9.44% |
| Sales Growth (1Y) | 19.56% |
| Sales Growth (3Y) | 11.71% |
| Sales Growth (5Y) | 10.31% |
| Sales per Share Growth (1Y) | 14.46% |
| Sales per Share Growth (3Y) | 2.86% |
| Operating Cash Flow - Growth Rate (3Y) | 19.60% |
As of March 31, 2026
Fund Details
| Key Dates | |
| Inception Date | 5/30/2008 |
| Last Annual Report Date | 10/31/2025 |
| Last Prospectus Date | 3/2/2026 |
| Share Classes | |
| HSFNX | Inv |
| Attributes | |
| Index Fund | -- |
| Inverse Fund | No |
| Leveraged Fund | -- |
| Fund of Funds | No |
| Currency Hedged Fund | -- |
| Socially Responsible Fund | No |
Top Portfolio Holders
| Name | % Weight |
|---|---|
| Portfolio A | 5.00% |
| Portfolio B | 3.50% |
| Portfolio C | 2.25% |
Excel Add-In Codes
| Name: =YCI("M:HISFX", "name") |
| Broad Asset Class: =YCI("M:HISFX", "broad_asset_class") |
| Broad Category: =YCI("M:HISFX", "broad_category_group") |
| Prospectus Objective: =YCI("M:HISFX", "prospectus_objective") |
| To find the codes for any of our securities and financial metrics, see our Complete Excel Reference. |