

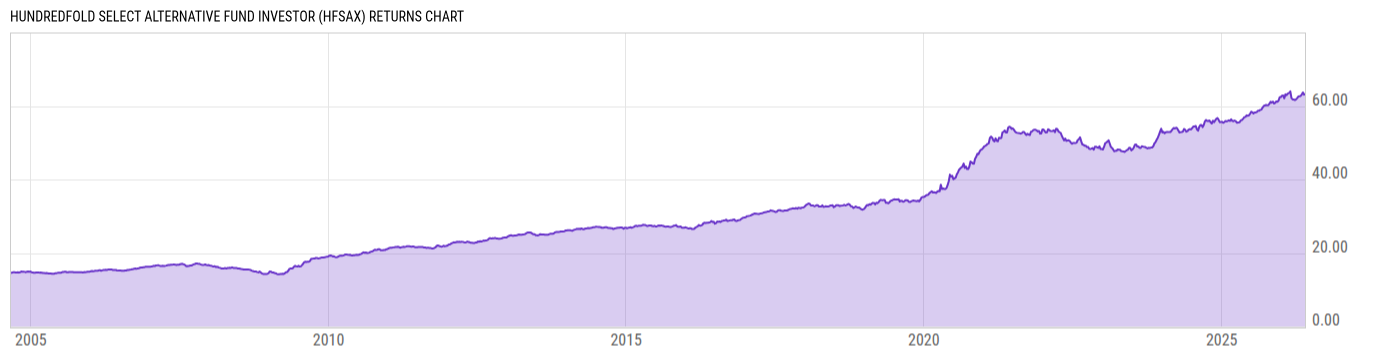
Hundredfold Select Alternative Fund Investor (HFSAX)
24.44
-0.04
(-0.16%)
USD |
May 27 2026
Returns Chart
Key Stats
| Net Expense Ratio | Total Assets Under Management | Weighted Average Dividend Yield | Turnover Ratio (Generic) |
|---|---|---|---|
| 2.02% | 136.91M | -- | 466.0% |
| 1 Year Fund Level Flows | 1 Year Total Returns (Daily) | Annualized Total Returns Since Inception (Daily) | Max Drawdown (Since Inception) |
| -24.95M | 10.84% |
Basic Info
| Investment Strategy | |
| The Fund seeks income and capital appreciation on a total return basis by investing primarily in high yield fixed-income securities, either directly or indirectly through exchange-traded funds (ETFs), other investment companies and derivative instruments. |
| General | |
| Security Type | Mutual Fund |
| Equity Style | -- |
| Broad Asset Class | Alternative |
| Broad Category | Alternative Strategies |
| Global Peer Group | Alternative Long/Short Equity US |
| Peer Group | Alternative Long/Short Equity Funds |
| Global Macro | Alternative Equity |
| US Macro | Alternative Equity Funds |
| YCharts Categorization | -- |
| YCharts Benchmark | -- |
| Prospectus Objective | Alternative Long/Short Equity Funds |
| Fund Owner Firm Name | Advisors Preferred |
| Broad Asset Class Benchmark Index | |
| ^MSACWINTR | 100.0% |
Net Fund Flows Versus Peer Group
1 Month
% Rank:
53
-77.77M
Peer Group Low
734.73M
Peer Group High
1 Year
% Rank:
86
-24.95M
-232.19M
Peer Group Low
5.181B
Peer Group High
3 Months
% Rank:
64
-58.92M
Peer Group Low
1.832B
Peer Group High
3 Years
% Rank:
87
-569.68M
Peer Group Low
8.511B
Peer Group High
6 Months
% Rank:
86
-150.87M
Peer Group Low
3.044B
Peer Group High
5 Years
% Rank:
86
-1.077B
Peer Group Low
8.721B
Peer Group High
YTD
% Rank:
86
-68.79M
Peer Group Low
2.522B
Peer Group High
10 Years
% Rank:
57
-6.886B
Peer Group Low
7.604B
Peer Group High
Date Unavailable
Risk
Performance Versus Peer Group
Annual Total Returns Versus Peers
As of May 28, 2026.
Asset Allocation
As of February 28, 2026.
| Type | % Net |
|---|---|
| Cash | 32.28% |
| Stock | 3.42% |
| Bond | 57.06% |
| Convertible | 0.00% |
| Preferred | 0.00% |
| Other | 7.24% |
Top 10 Holdings
| Name | % Weight | Price | % Change |
|---|---|---|---|
|
USD CASH
|
27.89% | -- | -- |
| American Beacon Developing World Income Fund R5 | 16.76% | 7.77 | 0.26% |
| PIMCO Income Fund Institutional | 11.32% | 10.81 | 0.09% |
| PGIM Securitized Credit Fund Z | 10.94% | 9.80 | 0.00% |
| AQR Diversifying Strategies Fund R6 | 10.19% | 14.70 | -0.54% |
| Easterly Income Opportunities Fund R6 | 8.36% | 10.34 | 0.00% |
| Thompson Bond Fund | 5.39% | 10.62 | -0.28% |
| Fidelity Instl Government Portfolio I | 4.91% | 1.00 | 0.00% |
|
HFSA FUND LTD
|
1.69% | -- | -- |
|
USD FUTURES
|
1.33% | -- | -- |
Fees & Availability
| Fees | |
| Actual 12B-1 Fee | -- |
| Actual Management Fee | 1.00% |
| Administration Fee | 155.6K% |
| Maximum Front Load | -- |
| Maximum Deferred Load | -- |
| Maximum Redemption Fee | -- |
| General Availability | |
| Available for Insurance Product | No |
| Available for RRSP | No |
| Purchase Details | |
| Open to New Investors |
|
| Minimum Initial Investment | 1.00M None |
| Minimum Subsequent Investment | 0.00 None |
Basic Info
| Investment Strategy | |
| The Fund seeks income and capital appreciation on a total return basis by investing primarily in high yield fixed-income securities, either directly or indirectly through exchange-traded funds (ETFs), other investment companies and derivative instruments. |
| General | |
| Security Type | Mutual Fund |
| Equity Style | -- |
| Broad Asset Class | Alternative |
| Broad Category | Alternative Strategies |
| Global Peer Group | Alternative Long/Short Equity US |
| Peer Group | Alternative Long/Short Equity Funds |
| Global Macro | Alternative Equity |
| US Macro | Alternative Equity Funds |
| YCharts Categorization | -- |
| YCharts Benchmark | -- |
| Prospectus Objective | Alternative Long/Short Equity Funds |
| Fund Owner Firm Name | Advisors Preferred |
| Broad Asset Class Benchmark Index | |
| ^MSACWINTR | 100.0% |
Fundamentals
| General | |
| Distribution Yield | -- |
| Dividend Yield TTM (5-26-26) | 9.59% |
| 30-Day SEC Yield | -- |
| 7-Day SEC Yield | -- |
| Number of Holdings | 27 |
| Stock | |
| Weighted Average PE Ratio | 25.21 |
| Weighted Average Price to Sales Ratio | 4.330 |
| Weighted Average Price to Book Ratio | 5.793 |
| Weighted Median ROE | 41.77% |
| Weighted Median ROA | 7.51% |
| ROI (TTM) | 13.09% |
| Return on Investment (TTM) | 13.09% |
| Earning Yield | 0.0560 |
| LT Debt / Shareholders Equity | 0.8928 |
| Number of Equity Holdings | 1 |
| Bond | |
| Yield to Maturity (2-28-26) | 5.96% |
| Effective Duration | -- |
| Average Coupon | 6.86% |
| Calculated Average Quality | 3.357 |
| Effective Maturity | 13.77 |
| Nominal Maturity | 14.08 |
| Number of Bond Holdings | 1 |
As of February 28, 2026
Growth Metrics
| EPS Growth (1Y) | 21.29% |
| EPS Growth (3Y) | 11.14% |
| EPS Growth (5Y) | 13.15% |
| Sales Growth (1Y) | 7.88% |
| Sales Growth (3Y) | 9.10% |
| Sales Growth (5Y) | 9.67% |
| Sales per Share Growth (1Y) | 11.70% |
| Sales per Share Growth (3Y) | 9.45% |
| Operating Cash Flow - Growth Rate (3Y) | 15.92% |
As of February 28, 2026
Fund Details
| Key Dates | |
| Inception Date | 10/24/2012 |
| Last Annual Report Date | 8/31/2025 |
| Last Prospectus Date | 12/31/2025 |
| Share Classes | |
| SFHYX | Service |
| Attributes | |
| Index Fund | -- |
| Inverse Fund | No |
| Leveraged Fund | -- |
| Fund of Funds | No |
| Currency Hedged Fund | -- |
| Socially Responsible Fund | No |
Top Portfolio Holders
| Name | % Weight |
|---|---|
| Portfolio A | 5.00% |
| Portfolio B | 3.50% |
| Portfolio C | 2.25% |
Excel Add-In Codes
| Name: =YCI("M:HFSAX", "name") |
| Broad Asset Class: =YCI("M:HFSAX", "broad_asset_class") |
| Broad Category: =YCI("M:HFSAX", "broad_category_group") |
| Prospectus Objective: =YCI("M:HFSAX", "prospectus_objective") |
| To find the codes for any of our securities and financial metrics, see our Complete Excel Reference. |