

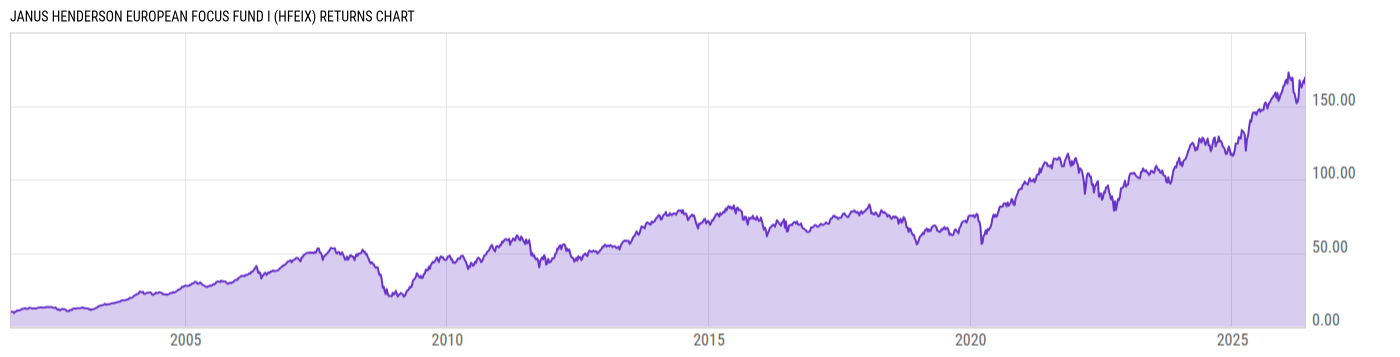
Janus Henderson European Focus Fund I (HFEIX)
63.33
+0.21
(+0.33%)
USD |
Jun 09 2026
Returns Chart
Key Stats
| Net Expense Ratio | Total Assets Under Management | Weighted Average Dividend Yield | Turnover Ratio (Generic) |
|---|---|---|---|
| 1.06% | 664.74M | 1.83% | 159.0% |
| 1 Year Fund Level Flows | 1 Year Total Returns (Daily) | Annualized Total Returns Since Inception (Daily) | Max Drawdown (Since Inception) |
| 14.15M | 15.10% |
Basic Info
| Investment Strategy | |
| The Fund seeks long-term capital appreciation primarily through investment in equities of European companies. The Fund invests at least 80% of its net assets (plus any borrowings for investment purposes) in equity securities of European companies. Equity securities include common stocks and related securities. |
| General | |
| Security Type | Mutual Fund |
| Equity Style | Large Cap Growth |
| Broad Asset Class | International Equity |
| Broad Category | Equity |
| Global Peer Group | Equity Europe |
| Peer Group | European Region Funds |
| Global Macro | Equity Europe |
| US Macro | Developed International Markets Funds |
| YCharts Categorization | -- |
| YCharts Benchmark | -- |
| Prospectus Objective | European Region Funds |
| Fund Owner Firm Name | Janus Henderson Investors |
| Broad Asset Class Benchmark Index | |
| ^MSACXUSNTR | 100.0% |
Net Fund Flows Versus Peer Group
1 Month
% Rank:
64
-470.93M
Peer Group Low
84.60M
Peer Group High
1 Year
% Rank:
50
14.15M
-1.366B
Peer Group Low
3.292B
Peer Group High
3 Months
% Rank:
63
-2.292B
Peer Group Low
1.198B
Peer Group High
3 Years
% Rank:
66
-3.076B
Peer Group Low
2.089B
Peer Group High
6 Months
% Rank:
75
-1.169B
Peer Group Low
1.293B
Peer Group High
5 Years
% Rank:
37
-1.809B
Peer Group Low
3.357B
Peer Group High
YTD
% Rank:
61
-1.413B
Peer Group Low
1.307B
Peer Group High
10 Years
% Rank:
92
-14.05B
Peer Group Low
5.935B
Peer Group High
Date Unavailable
Risk
Performance Versus Peer Group
Annual Total Returns Versus Peers
As of June 10, 2026.
Asset Allocation
As of March 31, 2026.
| Type | % Net |
|---|---|
| Cash | 0.00% |
| Stock | 91.24% |
| Bond | 0.00% |
| Convertible | 0.00% |
| Preferred | 0.00% |
| Other | 8.76% |
Top 10 Holdings
| Name | % Weight | Price | % Change |
|---|---|---|---|
|
Janus Cash Liquidity LLC
|
9.73% | -- | -- |
| ASML Holding NV | 5.59% | 1683.72 | -3.25% |
| Novartis AG | 4.27% | 144.88 | 0.00% |
| Banco Santander SA | 3.68% | 12.63 | 0.24% |
| Erste Group Bank AG | 3.68% | 118.59 | 0.00% |
| TotalEnergies SE | 3.58% | 88.48 | -0.17% |
| Iberdrola SA | 3.26% | 23.01 | 0.00% |
| Siemens AG | 3.10% | 302.60 | -0.72% |
| Roche Holding AG | 3.01% | 399.00 | 0.55% |
| Shell Plc | 2.99% | 43.40 | 2.04% |
Fees & Availability
| Fees | |
| Actual 12B-1 Fee | -- |
| Actual Management Fee | 0.85% |
| Administration Fee | -- |
| Maximum Front Load | -- |
| Maximum Deferred Load | -- |
| Maximum Redemption Fee | -- |
| General Availability | |
| Available for Insurance Product | No |
| Available for RRSP | No |
| Purchase Details | |
| Open to New Investors |
|
| Minimum Initial Investment | 0.00 None |
| Minimum Subsequent Investment | 0.00 None |
Basic Info
| Investment Strategy | |
| The Fund seeks long-term capital appreciation primarily through investment in equities of European companies. The Fund invests at least 80% of its net assets (plus any borrowings for investment purposes) in equity securities of European companies. Equity securities include common stocks and related securities. |
| General | |
| Security Type | Mutual Fund |
| Equity Style | Large Cap Growth |
| Broad Asset Class | International Equity |
| Broad Category | Equity |
| Global Peer Group | Equity Europe |
| Peer Group | European Region Funds |
| Global Macro | Equity Europe |
| US Macro | Developed International Markets Funds |
| YCharts Categorization | -- |
| YCharts Benchmark | -- |
| Prospectus Objective | European Region Funds |
| Fund Owner Firm Name | Janus Henderson Investors |
| Broad Asset Class Benchmark Index | |
| ^MSACXUSNTR | 100.0% |
Fundamentals
| General | |
| Distribution Yield | -- |
| Dividend Yield TTM (6-8-26) | 1.29% |
| 30-Day SEC Yield | -- |
| 7-Day SEC Yield | -- |
| Number of Holdings | 48 |
| Stock | |
| Weighted Average PE Ratio | 26.66 |
| Weighted Average Price to Sales Ratio | 3.446 |
| Weighted Average Price to Book Ratio | 5.220 |
| Weighted Median ROE | 32.42% |
| Weighted Median ROA | 6.81% |
| ROI (TTM) | 12.88% |
| Return on Investment (TTM) | 12.88% |
| Earning Yield | 0.0515 |
| LT Debt / Shareholders Equity | 0.7691 |
| Number of Equity Holdings | 44 |
As of March 31, 2026
Growth Metrics
| EPS Growth (1Y) | 17.94% |
| EPS Growth (3Y) | 8.76% |
| EPS Growth (5Y) | 16.58% |
| Sales Growth (1Y) | 8.73% |
| Sales Growth (3Y) | 6.46% |
| Sales Growth (5Y) | 10.26% |
| Sales per Share Growth (1Y) | 9.92% |
| Sales per Share Growth (3Y) | 6.27% |
| Operating Cash Flow - Growth Rate (3Y) | 13.15% |
As of March 31, 2026
Fund Details
Top Portfolio Holders
| Name | % Weight |
|---|---|
| Portfolio A | 5.00% |
| Portfolio B | 3.50% |
| Portfolio C | 2.25% |
Excel Add-In Codes
| Name: =YCI("M:HFEIX", "name") |
| Broad Asset Class: =YCI("M:HFEIX", "broad_asset_class") |
| Broad Category: =YCI("M:HFEIX", "broad_category_group") |
| Prospectus Objective: =YCI("M:HFEIX", "prospectus_objective") |
| To find the codes for any of our securities and financial metrics, see our Complete Excel Reference. |