

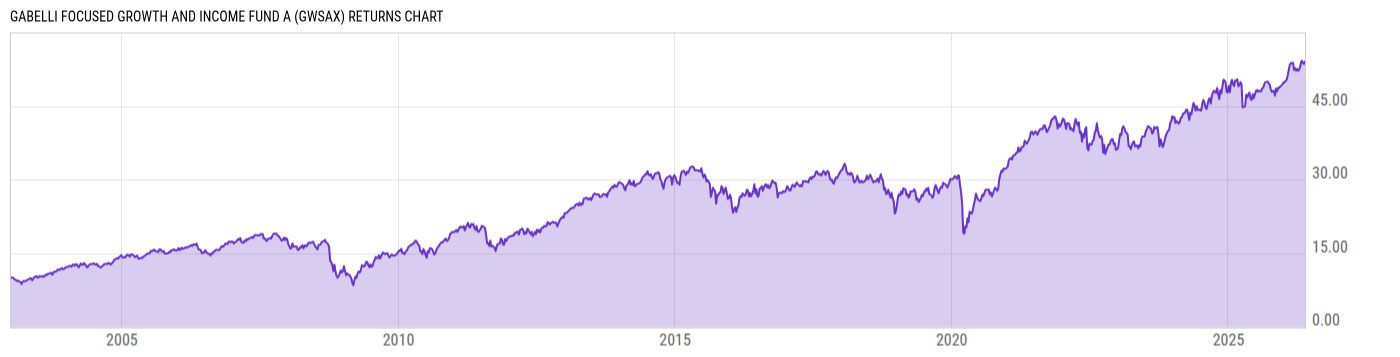
Gabelli Focused Growth and Income Fund A (GWSAX)
17.97
+0.10
(+0.56%)
USD |
Jun 09 2026
Returns Chart
Key Stats
| Net Expense Ratio | Total Assets Under Management | Weighted Average Dividend Yield | Turnover Ratio (Generic) |
|---|---|---|---|
| 1.25% | 46.17M | 3.88% | 35.00% |
| 1 Year Fund Level Flows | 1 Year Total Returns (Daily) | Annualized Total Returns Since Inception (Daily) | Max Drawdown (Since Inception) |
| -6.428M | 13.90% |
Basic Info
| Investment Strategy | |
| The Fund seeks to provide a high level of capital appreciation. The Fund primarily invests in common stocks. The Fund will invest up to 50% of its net assets in five companies with the remaining net assets to be invested across ten or twenty other companies or in short-term high grade investments or cash equivalents. |
| General | |
| Security Type | Mutual Fund |
| Equity Style | Multi Cap Value |
| Broad Asset Class | US Equity |
| Broad Category | Equity |
| Global Peer Group | Equity US |
| Peer Group | Multi-Cap Value Funds |
| Global Macro | Equity North America |
| US Macro | Multi-Cap Funds |
| YCharts Categorization | -- |
| YCharts Benchmark | -- |
| Prospectus Objective | -- |
| Fund Owner Firm Name | Gabelli |
| Broad Asset Class Benchmark Index | |
| ^SPXTR | 100.0% |
Net Fund Flows Versus Peer Group
1 Month
% Rank:
31
-1.190B
Peer Group Low
1.579B
Peer Group High
1 Year
% Rank:
29
-6.428M
-8.341B
Peer Group Low
8.912B
Peer Group High
3 Months
% Rank:
29
-2.558B
Peer Group Low
2.169B
Peer Group High
3 Years
% Rank:
25
-15.39B
Peer Group Low
17.10B
Peer Group High
6 Months
% Rank:
30
-6.079B
Peer Group Low
4.541B
Peer Group High
5 Years
% Rank:
26
-13.92B
Peer Group Low
32.94B
Peer Group High
YTD
% Rank:
33
-3.543B
Peer Group Low
3.482B
Peer Group High
10 Years
% Rank:
44
-32.35B
Peer Group Low
74.18B
Peer Group High
Date Unavailable
Risk
Performance Versus Peer Group
Annual Total Returns Versus Peers
As of June 11, 2026.
Asset Allocation
As of March 31, 2026.
| Type | % Net |
|---|---|
| Cash | 0.02% |
| Stock | 69.76% |
| Bond | 1.68% |
| Convertible | 0.00% |
| Preferred | 6.83% |
| Other | 21.71% |
Top 10 Holdings
| Name | % Weight | Price | % Change |
|---|---|---|---|
| Energy Transfer LP | 9.11% | 19.04 | -0.10% |
| AT&T, Inc. | 9.07% | 23.21 | 2.20% |
| Enterprise Products Partners LP | 8.31% | 37.87 | 1.39% |
| VICI Properties, Inc. | 7.95% | 28.41 | 1.39% |
| Franklin BSP Realty Trust, Inc. | 7.56% | 8.35 | 0.00% |
| Blackstone Mortgage Trust, Inc. | 5.15% | 18.23 | -0.82% |
| Kinder Morgan, Inc. | 4.79% | 31.84 | 1.60% |
| Kimbell Royalty Partners LP | 4.37% | 15.54 | 1.50% |
| ATN International, Inc. | 4.26% | 27.02 | 2.70% |
| XPLR Infrastructure LP | 4.08% | 11.47 | -1.46% |
Fees & Availability
| Fees | |
| Actual 12B-1 Fee | 0.25% |
| Actual Management Fee | 0.59% |
| Administration Fee | -- |
| Maximum Front Load | 5.75% |
| Maximum Deferred Load | -- |
| Maximum Redemption Fee | 2.00% |
| General Availability | |
| Available for Insurance Product | No |
| Available for RRSP | No |
| Purchase Details | |
| Open to New Investors |
|
| Minimum Initial Investment | 1000.00 None |
| Minimum Subsequent Investment | 0.00 None |
Basic Info
| Investment Strategy | |
| The Fund seeks to provide a high level of capital appreciation. The Fund primarily invests in common stocks. The Fund will invest up to 50% of its net assets in five companies with the remaining net assets to be invested across ten or twenty other companies or in short-term high grade investments or cash equivalents. |
| General | |
| Security Type | Mutual Fund |
| Equity Style | Multi Cap Value |
| Broad Asset Class | US Equity |
| Broad Category | Equity |
| Global Peer Group | Equity US |
| Peer Group | Multi-Cap Value Funds |
| Global Macro | Equity North America |
| US Macro | Multi-Cap Funds |
| YCharts Categorization | -- |
| YCharts Benchmark | -- |
| Prospectus Objective | -- |
| Fund Owner Firm Name | Gabelli |
| Broad Asset Class Benchmark Index | |
| ^SPXTR | 100.0% |
Fundamentals
| General | |
| Distribution Yield | -- |
| Dividend Yield TTM (6-8-26) | 4.65% |
| 30-Day SEC Yield | -- |
| 7-Day SEC Yield | -- |
| Number of Holdings | 43 |
Top Portfolio Holders
| Name | % Weight |
|---|---|
| Portfolio A | 5.00% |
| Portfolio B | 3.50% |
| Portfolio C | 2.25% |
Excel Add-In Codes
| Name: =YCI("M:GWSAX", "name") |
| Broad Asset Class: =YCI("M:GWSAX", "broad_asset_class") |
| Broad Category: =YCI("M:GWSAX", "broad_category_group") |
| Prospectus Objective: =YCI("M:GWSAX", "prospectus_objective") |
| To find the codes for any of our securities and financial metrics, see our Complete Excel Reference. |