

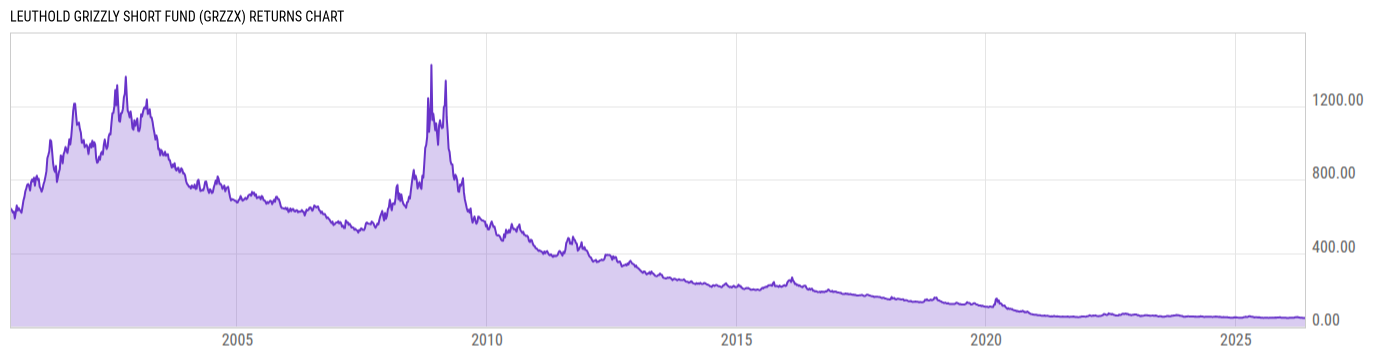
Leuthold Grizzly Short Fund (GRZZX)
19.60
+0.15
(+0.77%)
USD |
May 19 2026
Returns Chart
Key Stats
| Net Expense Ratio | Total Assets Under Management | Weighted Average Dividend Yield | Turnover Ratio (Generic) |
|---|---|---|---|
| 1.78% | 29.38M | -- | 0.00% |
| 1 Year Fund Level Flows | 1 Year Total Returns (Daily) | Annualized Total Returns Since Inception (Daily) | Max Drawdown (Since Inception) |
| -8.504M | -4.28% |
Basic Info
| Investment Strategy | |
| The Fund seeks capital appreciation by selling short common stocks of US companies. The aggregate amount of its outstanding securities sold short typically will be approximately equal to, or slightly less than, its net assets. The Fund utilizes a disciplined, unemotional, quantitative investment approach. |
| General | |
| Security Type | Mutual Fund |
| Equity Style | -- |
| Broad Asset Class | Alternative |
| Broad Category | Alternative Strategies |
| Global Peer Group | Alternative Dedicated Short Bias |
| Peer Group | Dedicated Short Bias Funds |
| Global Macro | Liquid Alternatives |
| US Macro | Alternative Equity Funds |
| YCharts Categorization | -- |
| YCharts Benchmark | -- |
| Prospectus Objective | Dedicated Short Bias Funds |
| Fund Owner Firm Name | Leuthold Group |
| Broad Asset Class Benchmark Index | |
| ^MSACWINTR | 100.0% |
Net Fund Flows Versus Peer Group
1 Month
% Rank:
91
-247.63M
Peer Group Low
2.348B
Peer Group High
1 Year
% Rank:
90
-8.504M
-577.45M
Peer Group Low
4.606B
Peer Group High
3 Months
% Rank:
91
-81.59M
Peer Group Low
2.000B
Peer Group High
3 Years
% Rank:
93
-509.34M
Peer Group Low
5.525B
Peer Group High
6 Months
% Rank:
87
-197.93M
Peer Group Low
2.366B
Peer Group High
5 Years
% Rank:
66
-736.99M
Peer Group Low
9.604B
Peer Group High
YTD
% Rank:
93
-197.99M
Peer Group Low
2.510B
Peer Group High
10 Years
% Rank:
95
-954.75M
Peer Group Low
14.96B
Peer Group High
Date Unavailable
Risk
Performance Versus Peer Group
Annual Total Returns Versus Peers
As of May 20, 2026.
Asset Allocation
As of March 31, 2026.
| Type | % Net |
|---|---|
| Cash | 76.00% |
| Stock | -99.46% |
| Bond | 14.21% |
| Convertible | 0.00% |
| Preferred | 0.00% |
| Other | 109.2% |
Top 10 Holdings
| Name | % Weight | Price | % Change |
|---|---|---|---|
|
Other Assets less Liabilities
|
109.3% | -- | -- |
|
US Bank NA Time/Term Deposit
|
76.00% | -- | -- |
| United States of America USGB 04/30/2026 FIX USD Government (Matured) | 14.24% | 100.00 | 0.01% |
|
USD Cash
|
0.00% | -- | -- |
| Walker & Dunlop, Inc. | -0.21% | 49.72 | 2.64% |
| Floor & Decor Holdings, Inc. | -0.21% | 47.04 | 6.38% |
| Blue Owl Capital, Inc. | -0.22% | 9.76 | 3.50% |
| Baxter International, Inc. | -0.24% | 18.76 | 2.37% |
| FactSet Research Systems, Inc. | -0.26% | 223.67 | 0.78% |
| First Watch Restaurant Group, Inc. | -0.26% | 10.97 | 0.73% |
Fees & Availability
| Fees | |
| Actual 12B-1 Fee | -- |
| Actual Management Fee | 1.25% |
| Administration Fee | 41.66K% |
| Maximum Front Load | -- |
| Maximum Deferred Load | -- |
| Maximum Redemption Fee | -- |
| General Availability | |
| Available for Insurance Product | No |
| Available for RRSP | No |
| Purchase Details | |
| Open to New Investors |
|
| Minimum Initial Investment | 10000.00 None |
| Minimum Subsequent Investment | 100.00 None |
Basic Info
| Investment Strategy | |
| The Fund seeks capital appreciation by selling short common stocks of US companies. The aggregate amount of its outstanding securities sold short typically will be approximately equal to, or slightly less than, its net assets. The Fund utilizes a disciplined, unemotional, quantitative investment approach. |
| General | |
| Security Type | Mutual Fund |
| Equity Style | -- |
| Broad Asset Class | Alternative |
| Broad Category | Alternative Strategies |
| Global Peer Group | Alternative Dedicated Short Bias |
| Peer Group | Dedicated Short Bias Funds |
| Global Macro | Liquid Alternatives |
| US Macro | Alternative Equity Funds |
| YCharts Categorization | -- |
| YCharts Benchmark | -- |
| Prospectus Objective | Dedicated Short Bias Funds |
| Fund Owner Firm Name | Leuthold Group |
| Broad Asset Class Benchmark Index | |
| ^MSACWINTR | 100.0% |
Fundamentals
| General | |
| Distribution Yield | -- |
| Dividend Yield TTM (5-18-26) | 5.31% |
| 30-Day SEC Yield | -- |
| 7-Day SEC Yield | -- |
| Number of Holdings | 114 |
| Stock | |
| Weighted Average PE Ratio | -- |
| Weighted Average Price to Sales Ratio | -- |
| Weighted Average Price to Book Ratio | -- |
| Weighted Median ROE | -- |
| Weighted Median ROA | -- |
| ROI (TTM) | -- |
| Return on Investment (TTM) | -- |
| Earning Yield | -- |
| LT Debt / Shareholders Equity | -- |
| Number of Equity Holdings | 102 |
| Bond | |
| Yield to Maturity (3-31-26) | 3.66% |
| Effective Duration | -- |
| Average Coupon | -- |
| Calculated Average Quality | 5.00 |
| Effective Maturity | 0.0833 |
| Nominal Maturity | 0.0833 |
| Number of Bond Holdings | 1 |
As of March 31, 2026
Growth Metrics
| EPS Growth (1Y) | -- |
| EPS Growth (3Y) | -- |
| EPS Growth (5Y) | -- |
| Sales Growth (1Y) | -- |
| Sales Growth (3Y) | -- |
| Sales Growth (5Y) | -- |
| Sales per Share Growth (1Y) | -- |
| Sales per Share Growth (3Y) | -- |
| Operating Cash Flow - Growth Rate (3Y) | -- |
As of March 31, 2026
Fund Details
| Key Dates | |
| Inception Date | 6/19/2000 |
| Last Annual Report Date | 9/30/2025 |
| Last Prospectus Date | 1/28/2025 |
| Attributes | |
| Index Fund | -- |
| Inverse Fund |
|
| Leveraged Fund | -- |
| Fund of Funds | No |
| Currency Hedged Fund | -- |
| Socially Responsible Fund | No |
Top Portfolio Holders
| Name | % Weight |
|---|---|
| Portfolio A | 5.00% |
| Portfolio B | 3.50% |
| Portfolio C | 2.25% |
Excel Add-In Codes
| Name: =YCI("M:GRZZX", "name") |
| Broad Asset Class: =YCI("M:GRZZX", "broad_asset_class") |
| Broad Category: =YCI("M:GRZZX", "broad_category_group") |
| Prospectus Objective: =YCI("M:GRZZX", "prospectus_objective") |
| To find the codes for any of our securities and financial metrics, see our Complete Excel Reference. |