

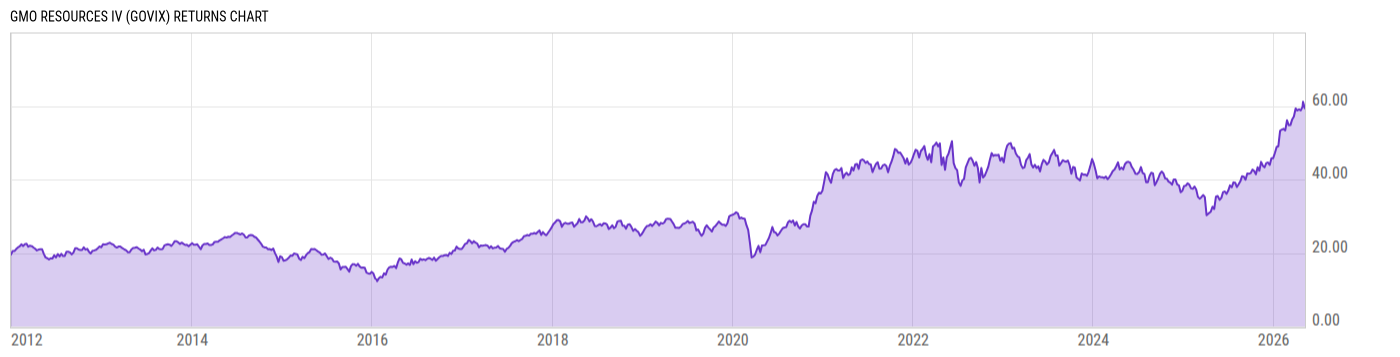
GMO Resources IV (GOVIX)
28.53
+0.05
(+0.18%)
USD |
May 29 2026
Returns Chart
Key Stats
| Net Expense Ratio | Total Assets Under Management | Weighted Average Dividend Yield | Turnover Ratio (Generic) |
|---|---|---|---|
| 0.65% | 1.303B | 1.80% | 43.00% |
| 1 Year Fund Level Flows | 1 Year Total Returns (Daily) | Annualized Total Returns Since Inception (Daily) | Max Drawdown (Since Inception) |
| -631.32M | 76.46% |
Basic Info
| Investment Strategy | |
| The Fund seeks total return. The Fund invests at least 80% of its assets in the securities of U.S. or non-U.S. issuer companies that own, produce, refine, process, transport, and market natural resources and companies that provide related equipment, infrastructure, and services in the natural resources sector. |
| General | |
| Security Type | Mutual Fund |
| Equity Style | Multi Cap Value |
| Broad Asset Class | Sector Equity |
| Broad Category | Equity |
| Global Peer Group | Equity Theme - Natural Resources |
| Peer Group | Global Natural Resources Funds |
| Global Macro | Equity Theme |
| US Macro | World Sector Equity Funds |
| YCharts Categorization | -- |
| YCharts Benchmark | -- |
| Prospectus Objective | Global Natural Resources Funds |
| Fund Owner Firm Name | GMO |
| Broad Asset Class Benchmark Index | |
| ^MSWNTR | 100.0% |
Net Fund Flows Versus Peer Group
1 Month
% Rank:
92
-114.58M
Peer Group Low
39.06M
Peer Group High
1 Year
% Rank:
98
-631.32M
-631.32M
Peer Group Low
711.16M
Peer Group High
3 Months
% Rank:
98
-72.35M
Peer Group Low
243.54M
Peer Group High
3 Years
% Rank:
90
-2.013B
Peer Group Low
2.675B
Peer Group High
6 Months
% Rank:
98
-192.46M
Peer Group Low
526.37M
Peer Group High
5 Years
% Rank:
78
-2.207B
Peer Group Low
2.675B
Peer Group High
YTD
% Rank:
98
-125.18M
Peer Group Low
566.11M
Peer Group High
10 Years
% Rank:
46
-6.756B
Peer Group Low
2.675B
Peer Group High
Date Unavailable
Risk
Performance Versus Peer Group
Annual Total Returns Versus Peers
As of May 31, 2026.
Asset Allocation
As of February 28, 2026.
| Type | % Net |
|---|---|
| Cash | 0.19% |
| Stock | 91.54% |
| Bond | 0.40% |
| Convertible | 0.00% |
| Preferred | 6.69% |
| Other | 1.19% |
Top 10 Holdings
| Name | % Weight | Price | % Change |
|---|---|---|---|
| Darling Ingredients, Inc. | 5.13% | 59.10 | -0.87% |
| Rio Tinto Plc | 4.74% | 104.44 | -0.66% |
| Kosmos Energy Ltd. | 4.44% | 2.80 | 2.19% |
| Glencore Plc | 4.36% | 7.71 | 0.98% |
| BP Plc | 3.96% | 6.83 | 0.00% |
| Albemarle Corp. | 3.70% | 176.42 | 0.06% |
|
Petroleo Brasileiro SA Petrobras
|
3.48% | -- | -- |
|
Bradespar SA
|
3.21% | -- | -- |
| California Resources Corp. | 3.20% | 59.29 | -2.74% |
| ConocoPhillips | 2.97% | 113.98 | -0.88% |
Fees & Availability
| Fees | |
| Actual 12B-1 Fee | -- |
| Actual Management Fee | 0.60% |
| Administration Fee | -- |
| Maximum Front Load | 0.00% |
| Maximum Deferred Load | -- |
| Maximum Redemption Fee | 0.00% |
| General Availability | |
| Available for Insurance Product | No |
| Available for RRSP | No |
| Purchase Details | |
| Open to New Investors |
|
| Minimum Initial Investment | 125.00M None |
| Minimum Subsequent Investment | 0.00 None |
Basic Info
| Investment Strategy | |
| The Fund seeks total return. The Fund invests at least 80% of its assets in the securities of U.S. or non-U.S. issuer companies that own, produce, refine, process, transport, and market natural resources and companies that provide related equipment, infrastructure, and services in the natural resources sector. |
| General | |
| Security Type | Mutual Fund |
| Equity Style | Multi Cap Value |
| Broad Asset Class | Sector Equity |
| Broad Category | Equity |
| Global Peer Group | Equity Theme - Natural Resources |
| Peer Group | Global Natural Resources Funds |
| Global Macro | Equity Theme |
| US Macro | World Sector Equity Funds |
| YCharts Categorization | -- |
| YCharts Benchmark | -- |
| Prospectus Objective | Global Natural Resources Funds |
| Fund Owner Firm Name | GMO |
| Broad Asset Class Benchmark Index | |
| ^MSWNTR | 100.0% |
Fundamentals
| General | |
| Distribution Yield | -- |
| Dividend Yield TTM (5-28-26) | 3.30% |
| 30-Day SEC Yield | -- |
| 7-Day SEC Yield | -- |
| Number of Holdings | 112 |
| Stock | |
| Weighted Average PE Ratio | 27.32 |
| Weighted Average Price to Sales Ratio | 2.826 |
| Weighted Average Price to Book Ratio | 2.494 |
| Weighted Median ROE | 3.77% |
| Weighted Median ROA | 2.42% |
| ROI (TTM) | 1.97% |
| Return on Investment (TTM) | 1.97% |
| Earning Yield | 0.0645 |
| LT Debt / Shareholders Equity | 0.7244 |
| Number of Equity Holdings | 107 |
As of February 28, 2026
Growth Metrics
| EPS Growth (1Y) | 10.09% |
| EPS Growth (3Y) | -16.19% |
| EPS Growth (5Y) | 5.77% |
| Sales Growth (1Y) | 7.57% |
| Sales Growth (3Y) | -1.16% |
| Sales Growth (5Y) | 12.62% |
| Sales per Share Growth (1Y) | 5.43% |
| Sales per Share Growth (3Y) | -2.44% |
| Operating Cash Flow - Growth Rate (3Y) | -0.16% |
As of February 28, 2026
Fund Details
Top Portfolio Holders
| Name | % Weight |
|---|---|
| Portfolio A | 5.00% |
| Portfolio B | 3.50% |
| Portfolio C | 2.25% |
Excel Add-In Codes
| Name: =YCI("M:GOVIX", "name") |
| Broad Asset Class: =YCI("M:GOVIX", "broad_asset_class") |
| Broad Category: =YCI("M:GOVIX", "broad_category_group") |
| Prospectus Objective: =YCI("M:GOVIX", "prospectus_objective") |
| To find the codes for any of our securities and financial metrics, see our Complete Excel Reference. |