

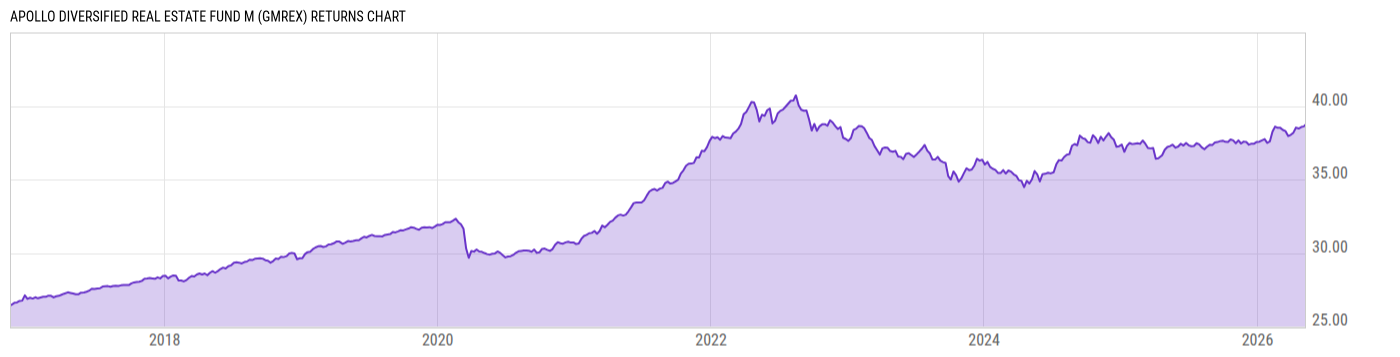
Apollo Diversified Real Estate Fund M (GMREX)
23.44
0.00 (0.00%)
USD |
Jun 03 2026
Returns Chart
Key Stats
| Net Expense Ratio | Total Assets Under Management | Weighted Average Dividend Yield | Turnover Ratio (Generic) |
|---|---|---|---|
| 2.64% | 3.368B | -- | 15.00% |
| 1 Year Fund Level Flows | 1 Year Total Returns (Daily) | Annualized Total Returns Since Inception (Daily) | Max Drawdown (Since Inception) |
| -- | 3.77% |
Basic Info
| Investment Strategy | |
| The Fund seeks to generate a balanced return comprised of current income and capital appreciation with moderate volatility and low correlation to the broader markets. The Fund will normally invest at least 80% in real estate securities. It will invest in private investment funds and publicly traded real estate securities. |
| General | |
| Security Type | Unlisted Closed-End Fund |
| Equity Style | -- |
| Broad Asset Class | Sector Equity |
| Broad Category | Equity |
| Global Peer Group | Equity Sector Real Estate US |
| Peer Group | Real Estate Funds |
| Global Macro | Equity Real Estate |
| US Macro | Sector Equity Funds |
| YCharts Categorization | -- |
| YCharts Benchmark | -- |
| Prospectus Objective | Real Estate Funds |
| Fund Owner Firm Name | Griffin Capital |
| Broad Asset Class Benchmark Index | |
| ^MSWNTR | 100.0% |
Net Fund Flows Versus Peer Group
1 Month
% Rank:
--
-1.958B
Peer Group Low
833.28M
Peer Group High
1 Year
% Rank:
--
-1.347B
Peer Group Low
1.065B
Peer Group High
3 Months
% Rank:
--
-1.898B
Peer Group Low
668.26M
Peer Group High
3 Years
% Rank:
--
-5.204B
Peer Group Low
2.527B
Peer Group High
6 Months
% Rank:
--
-1.720B
Peer Group Low
560.20M
Peer Group High
5 Years
% Rank:
--
-7.873B
Peer Group Low
3.884B
Peer Group High
YTD
% Rank:
--
-1.797B
Peer Group Low
318.65M
Peer Group High
10 Years
% Rank:
--
-7.585B
Peer Group Low
6.610B
Peer Group High
Date Unavailable
Risk
Performance Versus Peer Group
Annual Total Returns Versus Peers
As of June 03, 2026.
Asset Allocation
As of December 31, 2025.
| Type | % Net |
|---|---|
| Cash | 1.59% |
| Stock | 62.26% |
| Bond | 1.72% |
| Convertible | 0.00% |
| Preferred | 1.90% |
| Other | 32.53% |
Top 10 Holdings
| Name | % Weight | Price | % Change |
|---|---|---|---|
|
CBRE US Logistics Partners LP
|
8.08% | -- | -- |
|
Cortland Growth and Income LP
|
6.88% | -- | -- |
|
Ventas Life Science And Healthcare Real Estate Fund
|
4.90% | -- | -- |
|
TA Realty Logistics Fund LP
|
4.11% | -- | -- |
|
Prologis Targeted US Logistics Fund LP
|
4.08% | -- | -- |
|
Morgan Stanley Prime Property Fund
|
4.07% | -- | -- |
|
Dream US Industrial Fund LP
|
3.56% | -- | -- |
|
Ares Real Estate Enhanced Income Fund
|
3.41% | -- | -- |
|
Oaktree Real Estate Income Fund LP
|
3.34% | -- | -- |
|
CBRE US Credit Partners
|
3.31% | -- | -- |
Fees & Availability
| Fees | |
| Actual 12B-1 Fee | 0.75% |
| Actual Management Fee | 1.45% |
| Administration Fee | 300.0K% |
| Maximum Front Load | -- |
| Maximum Deferred Load | -- |
| Maximum Redemption Fee | -- |
| General Availability | |
| Available for Insurance Product | No |
| Available for RRSP | No |
| Purchase Details | |
| Open to New Investors |
|
| Minimum Initial Investment | 25000.00 None |
| Minimum Subsequent Investment | 0.00 None |
Basic Info
| Investment Strategy | |
| The Fund seeks to generate a balanced return comprised of current income and capital appreciation with moderate volatility and low correlation to the broader markets. The Fund will normally invest at least 80% in real estate securities. It will invest in private investment funds and publicly traded real estate securities. |
| General | |
| Security Type | Unlisted Closed-End Fund |
| Equity Style | -- |
| Broad Asset Class | Sector Equity |
| Broad Category | Equity |
| Global Peer Group | Equity Sector Real Estate US |
| Peer Group | Real Estate Funds |
| Global Macro | Equity Real Estate |
| US Macro | Sector Equity Funds |
| YCharts Categorization | -- |
| YCharts Benchmark | -- |
| Prospectus Objective | Real Estate Funds |
| Fund Owner Firm Name | Griffin Capital |
| Broad Asset Class Benchmark Index | |
| ^MSWNTR | 100.0% |
Fundamentals
| General | |
| Distribution Yield | -- |
| Dividend Yield TTM (6-2-26) | 5.29% |
| 30-Day SEC Yield | -- |
| 7-Day SEC Yield | -- |
| Number of Holdings | 140 |
Top Portfolio Holders
| Name | % Weight |
|---|---|
| Portfolio A | 5.00% |
| Portfolio B | 3.50% |
| Portfolio C | 2.25% |