

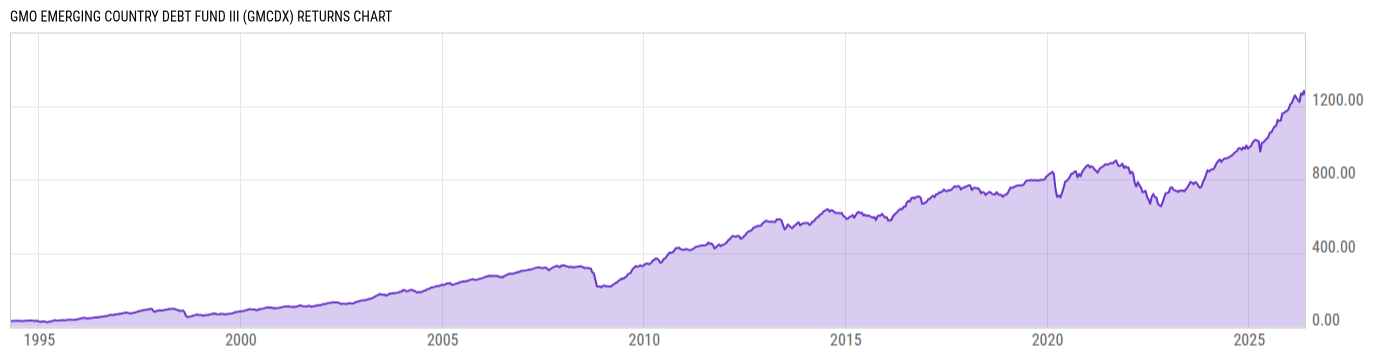
GMO Emerging Country Debt Fund III (GMCDX)
24.42
+0.05
(+0.21%)
USD |
Jun 09 2026
Returns Chart
Key Stats
| Net Expense Ratio | Total Assets Under Management | Weighted Average Dividend Yield | Turnover Ratio (Generic) |
|---|---|---|---|
| 0.54% | 2.267B | -- | 41.00% |
| 1 Year Fund Level Flows | 1 Year Total Returns (Daily) | Annualized Total Returns Since Inception (Daily) | Max Drawdown (Since Inception) |
| -574.58M | 25.80% |
Basic Info
| Investment Strategy | |
| The Fund seeks total return in excess of that of its benchmark, the J.P. Morgan EMBI Global Diversified. Under normal circumstances, the Fund invests directly and indirectly (e.g., through other GMO Funds or derivatives) at least 80% of its assets in debt investments tied economically to emerging countries. |
| General | |
| Security Type | Mutual Fund |
| Equity Style | -- |
| Broad Asset Class | Taxable Bond |
| Broad Category | Fixed Income |
| Global Peer Group | Bond Emerging Markets Global HC |
| Peer Group | Emerging Mrkts Hard Currency Debt Funds |
| Global Macro | Bond Emerging Markets |
| US Macro | Emerging Markets Debt Funds |
| YCharts Categorization | -- |
| YCharts Benchmark | -- |
| Prospectus Objective | Emerging Mrkts Hard Currency Debt Funds |
| Fund Owner Firm Name | GMO |
| Broad Asset Class Benchmark Index | |
| ^BBUSATR | 100.0% |
Net Fund Flows Versus Peer Group
1 Month
% Rank:
90
-479.78M
Peer Group Low
234.70M
Peer Group High
1 Year
% Rank:
97
-574.58M
-1.381B
Peer Group Low
3.137B
Peer Group High
3 Months
% Rank:
97
-2.227B
Peer Group Low
2.507B
Peer Group High
3 Years
% Rank:
100
-4.106B
Peer Group Low
4.991B
Peer Group High
6 Months
% Rank:
97
-1.796B
Peer Group Low
2.871B
Peer Group High
5 Years
% Rank:
98
-6.046B
Peer Group Low
4.725B
Peer Group High
YTD
% Rank:
97
-2.725B
Peer Group Low
2.885B
Peer Group High
10 Years
% Rank:
97
-6.580B
Peer Group Low
6.009B
Peer Group High
Date Unavailable
Risk
Performance Versus Peer Group
Annual Total Returns Versus Peers
As of June 09, 2026.
Asset Allocation
As of February 28, 2026.
| Type | % Net |
|---|---|
| Cash | 0.86% |
| Stock | 0.65% |
| Bond | 96.60% |
| Convertible | 0.00% |
| Preferred | 0.00% |
| Other | 1.89% |
Top 10 Holdings
| Name | % Weight | Price | % Change |
|---|---|---|---|
| Petroleos Mexicanos PEMEX 7.69 01/23/2050 FIX USD Corporate | 3.58% | 92.99 | 0.11% |
|
UNITED MEXICAN STATES (MEXICO) (GOVERNMENT) 5.625% 19-MAR-2114
|
2.18% | -- | -- |
|
NOMURA SECURITIES INTERNATIONAL INC REPO
|
2.04% | -- | -- |
|
OTHER ASSETS LESS LIABILITIES
|
1.89% | -- | -- |
| Republic of South Africa SOAF 5.75 09/30/2049 FIX USD Sovereign | 1.69% | 83.83 | 1.33% |
| Republic of Turkey TURKEY 5.75 05/11/2047 FIX USD Sovereign | 1.69% | 78.92 | 0.48% |
| PETROLEOS DEL PERU - PETROPERU S.A. PETRDEL 5.625 06/19/2047 FIX USD Corporate RegS | 1.65% | 72.88 | 0.05% |
| Argentine Republic ARGENT 4.125 07/09/2046 VAR USD Sovereign | 1.63% | 73.29 | -0.11% |
|
ZORLU ENERJI ELEKTRIK URETIM AS 11% 23-APR-2030
|
1.55% | -- | -- |
|
ECUADOR, REPUBLIC OF (GOVERNMENT) 6.9% 31-JUL-2035
|
1.52% | -- | -- |
Fees & Availability
| Fees | |
| Actual 12B-1 Fee | -- |
| Actual Management Fee | 0.50% |
| Administration Fee | -- |
| Maximum Front Load | 0.00% |
| Maximum Deferred Load | -- |
| Maximum Redemption Fee | 0.75% |
| General Availability | |
| Available for Insurance Product | No |
| Available for RRSP | No |
| Purchase Details | |
| Open to New Investors |
|
| Minimum Initial Investment | 0.00 None |
| Minimum Subsequent Investment | 0.00 None |
Basic Info
| Investment Strategy | |
| The Fund seeks total return in excess of that of its benchmark, the J.P. Morgan EMBI Global Diversified. Under normal circumstances, the Fund invests directly and indirectly (e.g., through other GMO Funds or derivatives) at least 80% of its assets in debt investments tied economically to emerging countries. |
| General | |
| Security Type | Mutual Fund |
| Equity Style | -- |
| Broad Asset Class | Taxable Bond |
| Broad Category | Fixed Income |
| Global Peer Group | Bond Emerging Markets Global HC |
| Peer Group | Emerging Mrkts Hard Currency Debt Funds |
| Global Macro | Bond Emerging Markets |
| US Macro | Emerging Markets Debt Funds |
| YCharts Categorization | -- |
| YCharts Benchmark | -- |
| Prospectus Objective | Emerging Mrkts Hard Currency Debt Funds |
| Fund Owner Firm Name | GMO |
| Broad Asset Class Benchmark Index | |
| ^BBUSATR | 100.0% |
Fundamentals
| General | |
| Distribution Yield | -- |
| Dividend Yield TTM (6-8-26) | 5.79% |
| 30-Day SEC Yield (7-30-21) | 5.25% |
| 7-Day SEC Yield | -- |
| Number of Holdings | 277 |
| Bond | |
| Yield to Maturity (2-28-26) | 7.56% |
| Effective Duration | 6.20 |
| Average Coupon | 6.64% |
| Calculated Average Quality | 5.225 |
| Effective Maturity | 15.74 |
| Nominal Maturity | 16.47 |
| Number of Bond Holdings | 236 |
As of February 28, 2026
Fund Details
Top Portfolio Holders
| Name | % Weight |
|---|---|
| Portfolio A | 5.00% |
| Portfolio B | 3.50% |
| Portfolio C | 2.25% |
Excel Add-In Codes
| Name: =YCI("M:GMCDX", "name") |
| Broad Asset Class: =YCI("M:GMCDX", "broad_asset_class") |
| Broad Category: =YCI("M:GMCDX", "broad_category_group") |
| Prospectus Objective: =YCI("M:GMCDX", "prospectus_objective") |
| To find the codes for any of our securities and financial metrics, see our Complete Excel Reference. |