

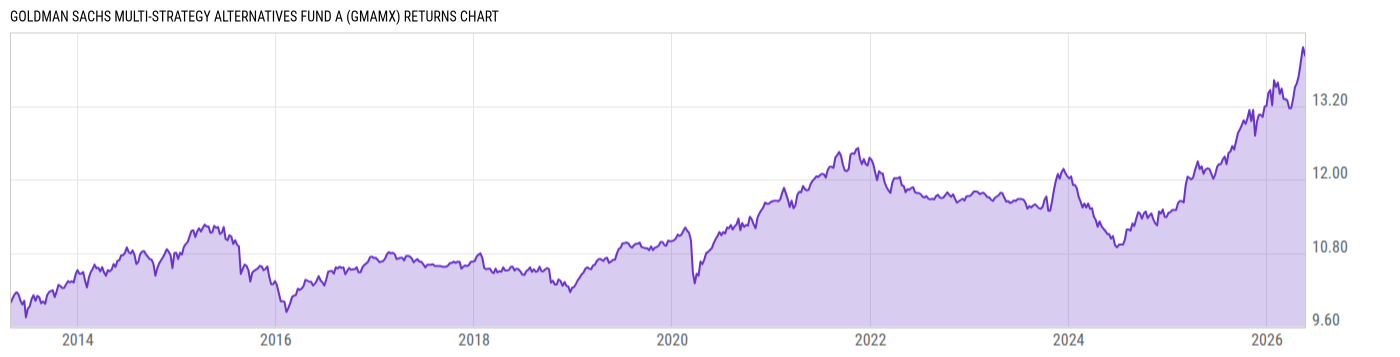
Goldman Sachs Multi-Strategy Alternatives Fund A (GMAMX)
11.34
-0.05
(-0.44%)
USD |
Jun 09 2026
Returns Chart
Key Stats
| Net Expense Ratio | Total Assets Under Management | Weighted Average Dividend Yield | Turnover Ratio (Generic) |
|---|---|---|---|
| 1.19% | 58.01M | -- | 46.00% |
| 1 Year Fund Level Flows | 1 Year Total Returns (Daily) | Annualized Total Returns Since Inception (Daily) | Max Drawdown (Since Inception) |
| -8.136M | 14.74% |
Basic Info
| Investment Strategy | |
| The Fund seeks long-term growth of capital. The Fund generally seeks to achieve its investment objective by allocating its assets among multiple investment managers (Underlying Managers) who are unaffiliated with the Investment Adviser and who employ one or more non-traditional and alternative investment strategies. |
| General | |
| Security Type | Mutual Fund |
| Equity Style | -- |
| Broad Asset Class | Alternative |
| Broad Category | Alternative Strategies |
| Global Peer Group | Alternative Multi Strategies |
| Peer Group | Alternative Multi-Strategy Funds |
| Global Macro | Liquid Alternatives |
| US Macro | Alternative Equity Funds |
| YCharts Categorization | -- |
| YCharts Benchmark | -- |
| Prospectus Objective | Alternative Multi-Strategy Funds |
| Fund Owner Firm Name | Goldman Sachs |
| Broad Asset Class Benchmark Index | |
| ^MSACWINTR | 100.0% |
Net Fund Flows Versus Peer Group
1 Month
% Rank:
53
-140.05M
Peer Group Low
558.92M
Peer Group High
1 Year
% Rank:
64
-8.136M
-552.08M
Peer Group Low
4.649B
Peer Group High
3 Months
% Rank:
67
-74.70M
Peer Group Low
1.340B
Peer Group High
3 Years
% Rank:
62
-1.663B
Peer Group Low
6.757B
Peer Group High
6 Months
% Rank:
68
-244.92M
Peer Group Low
2.749B
Peer Group High
5 Years
% Rank:
68
-2.277B
Peer Group Low
7.050B
Peer Group High
YTD
% Rank:
68
-195.06M
Peer Group Low
2.292B
Peer Group High
10 Years
% Rank:
92
-3.121B
Peer Group Low
7.072B
Peer Group High
Date Unavailable
Risk
Performance Versus Peer Group
Annual Total Returns Versus Peers
As of June 10, 2026.
Asset Allocation
As of January 31, 2026.
| Type | % Net |
|---|---|
| Cash | 17.68% |
| Stock | 3.39% |
| Bond | 61.68% |
| Convertible | 0.17% |
| Preferred | 1.47% |
| Other | 15.61% |
Top 10 Holdings
| Name | % Weight | Price | % Change |
|---|---|---|---|
| Vanguard Sht-Term Inflation-Protected Sec Idx ETF | 34.41% | 50.32 | -0.01% |
| Goldman Sachs FS Government Fund Institutional | 29.33% | 1.00 | 0.00% |
|
Other Assets less Liabilities
|
11.97% | -- | -- |
| Goldman Sachs Access US Preferred Stock and HS ETF | 7.79% | 49.95 | -0.01% |
| iShares Convertible Bond ETF | 5.87% | 115.55 | -1.55% |
| State Street SPDR Bloomberg Convertible Sec ETF | 2.92% | 103.42 | -1.21% |
| State Street SPDR Blackstone Senior Loan ETF | 2.29% | 40.22 | -0.29% |
| Vanguard Real Estate Index Fund ETF | 1.39% | 97.65 | -0.02% |
| iShares Core MSCI Emerging Markets ETF | 0.89% | 78.60 | -1.80% |
| iShares JPMorgan USD Emerging Markets Bond ETF | 0.73% | 95.36 | -0.32% |
Fees & Availability
| Fees | |
| Actual 12B-1 Fee | 0.25% |
| Actual Management Fee | -- |
| Administration Fee | -- |
| Maximum Front Load | 5.50% |
| Maximum Deferred Load | -- |
| Maximum Redemption Fee | -- |
| General Availability | |
| Available for Insurance Product | No |
| Available for RRSP | No |
| Purchase Details | |
| Open to New Investors |
|
| Minimum Initial Investment | 1000.00 None |
| Minimum Subsequent Investment | 50.00 None |
Basic Info
| Investment Strategy | |
| The Fund seeks long-term growth of capital. The Fund generally seeks to achieve its investment objective by allocating its assets among multiple investment managers (Underlying Managers) who are unaffiliated with the Investment Adviser and who employ one or more non-traditional and alternative investment strategies. |
| General | |
| Security Type | Mutual Fund |
| Equity Style | -- |
| Broad Asset Class | Alternative |
| Broad Category | Alternative Strategies |
| Global Peer Group | Alternative Multi Strategies |
| Peer Group | Alternative Multi-Strategy Funds |
| Global Macro | Liquid Alternatives |
| US Macro | Alternative Equity Funds |
| YCharts Categorization | -- |
| YCharts Benchmark | -- |
| Prospectus Objective | Alternative Multi-Strategy Funds |
| Fund Owner Firm Name | Goldman Sachs |
| Broad Asset Class Benchmark Index | |
| ^MSACWINTR | 100.0% |
Fundamentals
| General | |
| Distribution Yield | -- |
| Dividend Yield TTM (6-8-26) | 7.74% |
| 30-Day SEC Yield | -- |
| 7-Day SEC Yield | -- |
| Number of Holdings | 172 |
| Bond | |
| Yield to Maturity (1-31-26) | 0.81% |
| Effective Duration | -- |
| Average Coupon | 1.87% |
| Calculated Average Quality | 2.508 |
| Effective Maturity | 4.666 |
| Nominal Maturity | 7.174 |
| Number of Bond Holdings | 0 |
As of January 31, 2026
Fund Details
Top Portfolio Holders
| Name | % Weight |
|---|---|
| Portfolio A | 5.00% |
| Portfolio B | 3.50% |
| Portfolio C | 2.25% |
Excel Add-In Codes
| Name: =YCI("M:GMAMX", "name") |
| Broad Asset Class: =YCI("M:GMAMX", "broad_asset_class") |
| Broad Category: =YCI("M:GMAMX", "broad_category_group") |
| Prospectus Objective: =YCI("M:GMAMX", "prospectus_objective") |
| To find the codes for any of our securities and financial metrics, see our Complete Excel Reference. |