

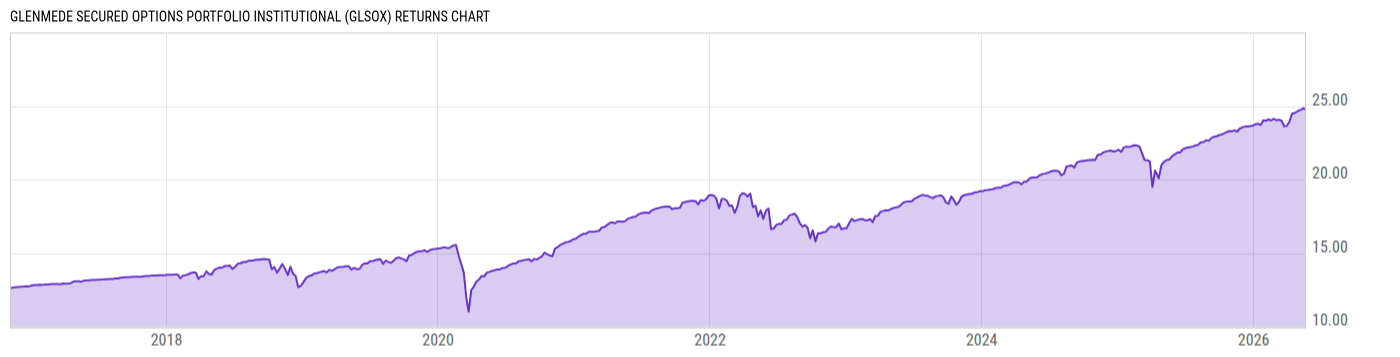
Glenmede Secured Options Portfolio Institutional (GLSOX)
14.75
-0.01
(-0.07%)
USD |
Jun 09 2026
Returns Chart
Key Stats
| Net Expense Ratio | Total Assets Under Management | Weighted Average Dividend Yield | Turnover Ratio (Generic) |
|---|---|---|---|
| 0.66% | 366.86M | -- | -- |
| 1 Year Fund Level Flows | 1 Year Total Returns (Daily) | Annualized Total Returns Since Inception (Daily) | Max Drawdown (Since Inception) |
| -222.64M | 14.34% |
Basic Info
| Investment Strategy | |
| The Fund seeks long term capital appreciation and option premiums consistent with reasonable risk to principal. Under normal market circumstances, the Fund invests in a diversified portfolio of equity securities while also using option writing strategies in an effort to obtain option premiums and reduce risk. |
| General | |
| Security Type | Mutual Fund |
| Equity Style | -- |
| Broad Asset Class | Nontraditional Equity |
| Broad Category | Alternative Strategies |
| Global Peer Group | Alternative Relative Value |
| Peer Group | Options Arbitrage/Opt Strategies Funds |
| Global Macro | Liquid Alternatives |
| US Macro | Equity Income Funds |
| YCharts Categorization | -- |
| YCharts Benchmark | -- |
| Prospectus Objective | Options Arbitrage/Opt Strategies Funds |
| Fund Owner Firm Name | Glenmede Funds |
| Broad Asset Class Benchmark Index | |
| ^SPXTR | 100.0% |
Net Fund Flows Versus Peer Group
1 Month
% Rank:
73
-768.19M
Peer Group Low
415.71M
Peer Group High
1 Year
% Rank:
98
-222.64M
-3.282B
Peer Group Low
1.657B
Peer Group High
3 Months
% Rank:
95
-1.357B
Peer Group Low
1.509B
Peer Group High
3 Years
% Rank:
98
-1.595B
Peer Group Low
6.215B
Peer Group High
6 Months
% Rank:
96
-2.148B
Peer Group Low
1.509B
Peer Group High
5 Years
% Rank:
99
-4.971B
Peer Group Low
7.039B
Peer Group High
YTD
% Rank:
94
-1.964B
Peer Group Low
1.509B
Peer Group High
10 Years
% Rank:
100
-5.777B
Peer Group Low
9.485B
Peer Group High
Date Unavailable
Risk
Performance Versus Peer Group
Annual Total Returns Versus Peers
As of June 10, 2026.
Asset Allocation
As of January 31, 2026.
| Type | % Net |
|---|---|
| Cash | 2.94% |
| Stock | 8.17% |
| Bond | 16.12% |
| Convertible | 0.00% |
| Preferred | 0.00% |
| Other | 72.77% |
Top 10 Holdings
| Name | % Weight | Price | % Change |
|---|---|---|---|
|
SPX MAR6 6000.0C
|
67.09% | -- | -- |
|
SPX MAR6 4000.0C
|
15.44% | -- | -- |
|
SPX MAR6 7000.0P
|
10.98% | -- | -- |
| United States of America USGB 04/09/2026 FIX USD Government (Matured) | 8.98% | 100.00 | 0.01% |
| United States of America USGB 02/10/2026 FIX USD Government (Matured) | 7.13% | -- | -- |
| Vanguard 500 Index Fund ETF | 4.54% | 667.05 | -1.57% |
| State Street SPDR S&P 500 ETF Trust | 3.64% | 725.69 | -1.54% |
|
USD CASH
|
2.85% | -- | -- |
|
FIXED INCOME CLEARING CORP REPO
|
0.09% | -- | -- |
|
SPX MAR6 5000.0P
|
0.02% | -- | -- |
Fees & Availability
| Fees | |
| Actual 12B-1 Fee | -- |
| Actual Management Fee | 0.55% |
| Administration Fee | 203.6K% |
| Maximum Front Load | -- |
| Maximum Deferred Load | -- |
| Maximum Redemption Fee | -- |
| General Availability | |
| Available for Insurance Product | No |
| Available for RRSP | No |
| Purchase Details | |
| Open to New Investors |
|
| Minimum Initial Investment | 10.00M None |
| Minimum Subsequent Investment | 0.00 None |
Basic Info
| Investment Strategy | |
| The Fund seeks long term capital appreciation and option premiums consistent with reasonable risk to principal. Under normal market circumstances, the Fund invests in a diversified portfolio of equity securities while also using option writing strategies in an effort to obtain option premiums and reduce risk. |
| General | |
| Security Type | Mutual Fund |
| Equity Style | -- |
| Broad Asset Class | Nontraditional Equity |
| Broad Category | Alternative Strategies |
| Global Peer Group | Alternative Relative Value |
| Peer Group | Options Arbitrage/Opt Strategies Funds |
| Global Macro | Liquid Alternatives |
| US Macro | Equity Income Funds |
| YCharts Categorization | -- |
| YCharts Benchmark | -- |
| Prospectus Objective | Options Arbitrage/Opt Strategies Funds |
| Fund Owner Firm Name | Glenmede Funds |
| Broad Asset Class Benchmark Index | |
| ^SPXTR | 100.0% |
Fundamentals
| General | |
| Distribution Yield | -- |
| Dividend Yield TTM (6-8-26) | 0.25% |
| 30-Day SEC Yield | -- |
| 7-Day SEC Yield | -- |
| Number of Holdings | 10 |
Fund Details
| Key Dates | |
| Inception Date | 11/9/2016 |
| Last Annual Report Date | 10/31/2025 |
| Last Prospectus Date | 2/28/2026 |
| Share Classes | |
| GTSOX | Adv |
| Attributes | |
| Index Fund | -- |
| Inverse Fund | No |
| Leveraged Fund | -- |
| Fund of Funds | No |
| Currency Hedged Fund | -- |
| Socially Responsible Fund | No |
Top Portfolio Holders
| Name | % Weight |
|---|---|
| Portfolio A | 5.00% |
| Portfolio B | 3.50% |
| Portfolio C | 2.25% |
Excel Add-In Codes
| Name: =YCI("M:GLSOX", "name") |
| Broad Asset Class: =YCI("M:GLSOX", "broad_asset_class") |
| Broad Category: =YCI("M:GLSOX", "broad_category_group") |
| Prospectus Objective: =YCI("M:GLSOX", "prospectus_objective") |
| To find the codes for any of our securities and financial metrics, see our Complete Excel Reference. |