

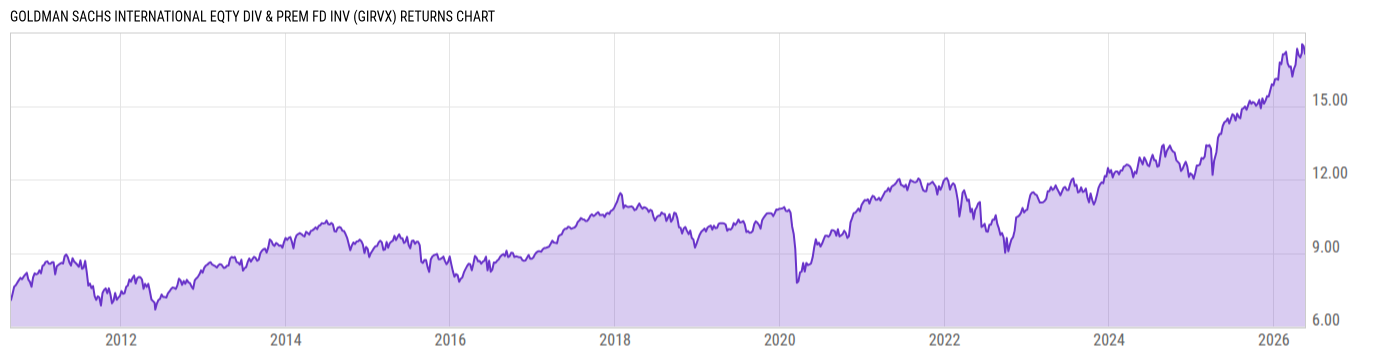
Goldman Sachs International Eqty Div & Prem Fd Inv (GIRVX)
9.16
0.00 (0.00%)
USD |
Jun 09 2026
Returns Chart
Key Stats
| Net Expense Ratio | Total Assets Under Management | Weighted Average Dividend Yield | Turnover Ratio (Generic) |
|---|---|---|---|
| 0.94% | 145.74M | 3.63% | 16.00% |
| 1 Year Fund Level Flows | 1 Year Total Returns (Daily) | Annualized Total Returns Since Inception (Daily) | Max Drawdown (Since Inception) |
| -24.53M | 17.95% |
Basic Info
| Investment Strategy | |
| The Fund seeks to maximize total return with an emphasis on income. The Fund normally invests at least 80% of its net assets in dividend-paying equity investments in non-U.S. issuers with public stock market capitalizations within the range of the market capitalization of the MSCI EAFE Index at the time of investment. |
| General | |
| Security Type | Mutual Fund |
| Equity Style | Large Cap Value |
| Broad Asset Class | International Equity |
| Broad Category | Equity |
| Global Peer Group | Equity Global Income |
| Peer Group | International Equity Income Funds |
| Global Macro | Equity Global |
| US Macro | Developed International Markets Funds |
| YCharts Categorization | -- |
| YCharts Benchmark | -- |
| Prospectus Objective | International Funds |
| Fund Owner Firm Name | Goldman Sachs |
| Broad Asset Class Benchmark Index | |
| ^MSACXUSNTR | 100.0% |
Net Fund Flows Versus Peer Group
1 Month
% Rank:
61
-122.66M
Peer Group Low
201.51M
Peer Group High
1 Year
% Rank:
71
-24.53M
-705.67M
Peer Group Low
5.930B
Peer Group High
3 Months
% Rank:
75
-218.22M
Peer Group Low
549.16M
Peer Group High
3 Years
% Rank:
77
-1.863B
Peer Group Low
8.513B
Peer Group High
6 Months
% Rank:
64
-493.35M
Peer Group Low
3.622B
Peer Group High
5 Years
% Rank:
91
-3.770B
Peer Group Low
12.15B
Peer Group High
YTD
% Rank:
72
-507.71M
Peer Group Low
2.979B
Peer Group High
10 Years
% Rank:
79
-5.323B
Peer Group Low
14.75B
Peer Group High
Date Unavailable
Risk
Performance Versus Peer Group
Annual Total Returns Versus Peers
As of June 10, 2026.
Asset Allocation
As of December 31, 2025.
| Type | % Net |
|---|---|
| Cash | 0.71% |
| Stock | 98.88% |
| Bond | 0.00% |
| Convertible | 0.00% |
| Preferred | 0.76% |
| Other | -0.36% |
Top 10 Holdings
| Name | % Weight | Price | % Change |
|---|---|---|---|
| ASML Holding NV | 2.51% | 1683.72 | -3.25% |
| Shell Plc | 1.96% | 43.40 | 2.04% |
| Rio Tinto Plc | 1.90% | 101.42 | 0.49% |
| HSBC Holdings Plc | 1.67% | 89.34 | -2.39% |
| Roche Holding AG | 1.62% | 399.00 | 0.55% |
| BHP Group Ltd. | 1.60% | 42.35 | 0.95% |
| National Australia Bank Ltd. | 1.52% | 23.35 | -11.55% |
| Novartis AG | 1.48% | 144.88 | 0.00% |
| Intesa Sanpaolo SpA | 1.39% | 6.573 | 3.35% |
| Nestlé SA | 1.33% | 97.99 | 2.16% |
Fees & Availability
| Fees | |
| Actual 12B-1 Fee | -- |
| Actual Management Fee | 0.46% |
| Administration Fee | -- |
| Maximum Front Load | -- |
| Maximum Deferred Load | -- |
| Maximum Redemption Fee | 0.00% |
| General Availability | |
| Available for Insurance Product | No |
| Available for RRSP | No |
| Purchase Details | |
| Open to New Investors |
|
| Minimum Initial Investment | 0.00 None |
| Minimum Subsequent Investment | 0.00 None |
Basic Info
| Investment Strategy | |
| The Fund seeks to maximize total return with an emphasis on income. The Fund normally invests at least 80% of its net assets in dividend-paying equity investments in non-U.S. issuers with public stock market capitalizations within the range of the market capitalization of the MSCI EAFE Index at the time of investment. |
| General | |
| Security Type | Mutual Fund |
| Equity Style | Large Cap Value |
| Broad Asset Class | International Equity |
| Broad Category | Equity |
| Global Peer Group | Equity Global Income |
| Peer Group | International Equity Income Funds |
| Global Macro | Equity Global |
| US Macro | Developed International Markets Funds |
| YCharts Categorization | -- |
| YCharts Benchmark | -- |
| Prospectus Objective | International Funds |
| Fund Owner Firm Name | Goldman Sachs |
| Broad Asset Class Benchmark Index | |
| ^MSACXUSNTR | 100.0% |
Fundamentals
| General | |
| Distribution Yield | -- |
| Dividend Yield TTM (6-8-26) | 2.65% |
| 30-Day SEC Yield (4-30-26) | 2.05% |
| 7-Day SEC Yield | -- |
| Number of Holdings | 290 |
| Stock | |
| Weighted Average PE Ratio | 23.40 |
| Weighted Average Price to Sales Ratio | 3.569 |
| Weighted Average Price to Book Ratio | 4.448 |
| Weighted Median ROE | 21.77% |
| Weighted Median ROA | 6.30% |
| ROI (TTM) | 11.59% |
| Return on Investment (TTM) | 11.59% |
| Earning Yield | 0.0555 |
| LT Debt / Shareholders Equity | 0.8376 |
| Number of Equity Holdings | 279 |
As of December 31, 2025
Growth Metrics
| EPS Growth (1Y) | 15.12% |
| EPS Growth (3Y) | 6.41% |
| EPS Growth (5Y) | 12.24% |
| Sales Growth (1Y) | 5.06% |
| Sales Growth (3Y) | 6.67% |
| Sales Growth (5Y) | 6.05% |
| Sales per Share Growth (1Y) | 5.94% |
| Sales per Share Growth (3Y) | 7.45% |
| Operating Cash Flow - Growth Rate (3Y) | 5.97% |
As of December 31, 2025
Fund Details
Top Portfolio Holders
| Name | % Weight |
|---|---|
| Portfolio A | 5.00% |
| Portfolio B | 3.50% |
| Portfolio C | 2.25% |
Excel Add-In Codes
| Name: =YCI("M:GIRVX", "name") |
| Broad Asset Class: =YCI("M:GIRVX", "broad_asset_class") |
| Broad Category: =YCI("M:GIRVX", "broad_category_group") |
| Prospectus Objective: =YCI("M:GIRVX", "prospectus_objective") |
| To find the codes for any of our securities and financial metrics, see our Complete Excel Reference. |