

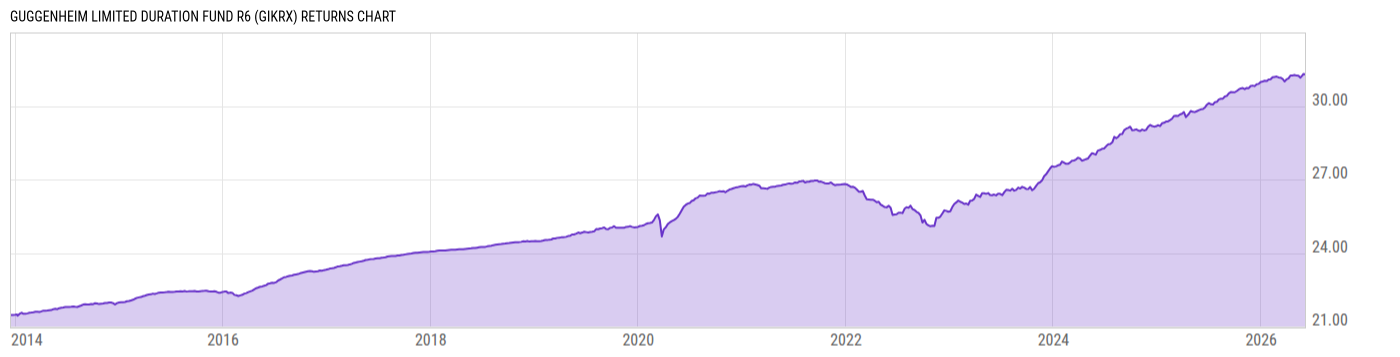
Guggenheim Limited Duration Fund R6 (GIKRX)
24.50
-0.01
(-0.04%)
USD |
Jun 03 2026
Returns Chart
Key Stats
| Net Expense Ratio | Total Assets Under Management | Weighted Average Dividend Yield | Turnover Ratio (Generic) |
|---|---|---|---|
| 0.42% | 5.791B | -- | 49.00% |
| 1 Year Fund Level Flows | 1 Year Total Returns (Daily) | Annualized Total Returns Since Inception (Daily) | Max Drawdown (Since Inception) |
| 571.49M | 4.72% |
Basic Info
| Investment Strategy | |
| The Fund seeks to provide a high level of income consistent with preservation of capital by investing at least 80% of its assets in a diversified portfolio of debt securities. The Fund may not invest more than 35% of its total assets in debt securities listed, traded or dealt in emerging market countries. |
| General | |
| Security Type | Mutual Fund |
| Equity Style | -- |
| Broad Asset Class | Taxable Bond |
| Broad Category | Fixed Income |
| Global Peer Group | Bond USD Short Term |
| Peer Group | Short Investment Grade Debt Funds |
| Global Macro | Bond Short Term |
| US Macro | Short/Intermediate Investment-Grade Funds |
| YCharts Categorization | -- |
| YCharts Benchmark | -- |
| Prospectus Objective | Short Investment Grade Debt Funds |
| Fund Owner Firm Name | Guggenheim |
| Broad Asset Class Benchmark Index | |
| ^BBUSATR | 100.0% |
Net Fund Flows Versus Peer Group
1 Month
% Rank:
91
-151.00M
Peer Group Low
1.615B
Peer Group High
1 Year
% Rank:
11
571.49M
-5.690B
Peer Group Low
6.766B
Peer Group High
3 Months
% Rank:
85
-2.968B
Peer Group Low
3.273B
Peer Group High
3 Years
% Rank:
9
-11.60B
Peer Group Low
8.054B
Peer Group High
6 Months
% Rank:
22
-4.269B
Peer Group Low
6.766B
Peer Group High
5 Years
% Rank:
64
-25.47B
Peer Group Low
9.200B
Peer Group High
YTD
% Rank:
23
-3.260B
Peer Group Low
6.765B
Peer Group High
10 Years
% Rank:
7
-10.99B
Peer Group Low
24.01B
Peer Group High
Date Unavailable
Risk
Performance Versus Peer Group
Annual Total Returns Versus Peers
As of June 04, 2026.
Asset Allocation
As of March 31, 2026.
| Type | % Net |
|---|---|
| Cash | 2.95% |
| Stock | 0.06% |
| Bond | 95.93% |
| Convertible | 0.00% |
| Preferred | 0.00% |
| Other | 1.06% |
Top 10 Holdings
| Name | % Weight | Price | % Change |
|---|---|---|---|
| FNMA-New 05/15/2029 FIX USD Agency | 8.09% | 98.96 | -0.04% |
| BNY Dreyfus Treasury Obligations Cash Mgmt Inst | 2.01% | 1.00 | 0.00% |
|
Federal National Mortgage Association 4.5% 01-JUN-2041
|
1.80% | -- | -- |
|
Federal National Mortgage Association 5% 01-JUN-2056
|
1.04% | -- | -- |
| FEDERAL NATIONAL MORTGAGE ASSOCIATION FNMA-New 5.5 03/25/2036 FIX USD Agency | 0.80% | 100.20 | -0.14% |
|
Federal Home Loan Mortgage Corp 01-FEB-2056 RQ0095
|
0.79% | -- | -- |
|
FEDERAL HOME LOAN MORTGAGE CORPORATION 5644E BA SEQ FIX 5% 25-JUL-2055
|
0.76% | -- | -- |
|
Federal Home Loan Mortgage Corp 01-JUN-2055 RQ0012
|
0.75% | -- | -- |
|
GOLUB CAPITAL PARTNERS CLO LTD 54R A1R FLT 5.1332% 05-AUG-2037
|
0.74% | -- | -- |
|
NLT TRUST 25NQM1 PT 7.46582% 25-OCT-2070
|
0.69% | -- | -- |
Fees & Availability
| Fees | |
| Actual 12B-1 Fee | -- |
| Actual Management Fee | 0.35% |
| Administration Fee | 60.98K% |
| Maximum Front Load | -- |
| Maximum Deferred Load | -- |
| Maximum Redemption Fee | -- |
| General Availability | |
| Available for Insurance Product | No |
| Available for RRSP | No |
| Purchase Details | |
| Open to New Investors |
|
| Minimum Initial Investment | 2.00M None |
| Minimum Subsequent Investment | 0.00 None |
Basic Info
| Investment Strategy | |
| The Fund seeks to provide a high level of income consistent with preservation of capital by investing at least 80% of its assets in a diversified portfolio of debt securities. The Fund may not invest more than 35% of its total assets in debt securities listed, traded or dealt in emerging market countries. |
| General | |
| Security Type | Mutual Fund |
| Equity Style | -- |
| Broad Asset Class | Taxable Bond |
| Broad Category | Fixed Income |
| Global Peer Group | Bond USD Short Term |
| Peer Group | Short Investment Grade Debt Funds |
| Global Macro | Bond Short Term |
| US Macro | Short/Intermediate Investment-Grade Funds |
| YCharts Categorization | -- |
| YCharts Benchmark | -- |
| Prospectus Objective | Short Investment Grade Debt Funds |
| Fund Owner Firm Name | Guggenheim |
| Broad Asset Class Benchmark Index | |
| ^BBUSATR | 100.0% |
Fundamentals
| General | |
| Distribution Yield | -- |
| Dividend Yield TTM (6-2-26) | 4.62% |
| 30-Day SEC Yield (4-30-26) | 4.72% |
| 7-Day SEC Yield | -- |
| Number of Holdings | 837 |
| Bond | |
| Yield to Maturity (3-31-26) | 5.10% |
| Effective Duration | 2.20 |
| Average Coupon | 4.94% |
| Calculated Average Quality | 2.385 |
| Effective Maturity | 16.44 |
| Nominal Maturity | 16.59 |
| Number of Bond Holdings | 784 |
As of March 31, 2026
Fund Details
Top Portfolio Holders
| Name | % Weight |
|---|---|
| Portfolio A | 5.00% |
| Portfolio B | 3.50% |
| Portfolio C | 2.25% |
Excel Add-In Codes
| Name: =YCI("M:GIKRX", "name") |
| Broad Asset Class: =YCI("M:GIKRX", "broad_asset_class") |
| Broad Category: =YCI("M:GIKRX", "broad_category_group") |
| Prospectus Objective: =YCI("M:GIKRX", "prospectus_objective") |
| To find the codes for any of our securities and financial metrics, see our Complete Excel Reference. |