

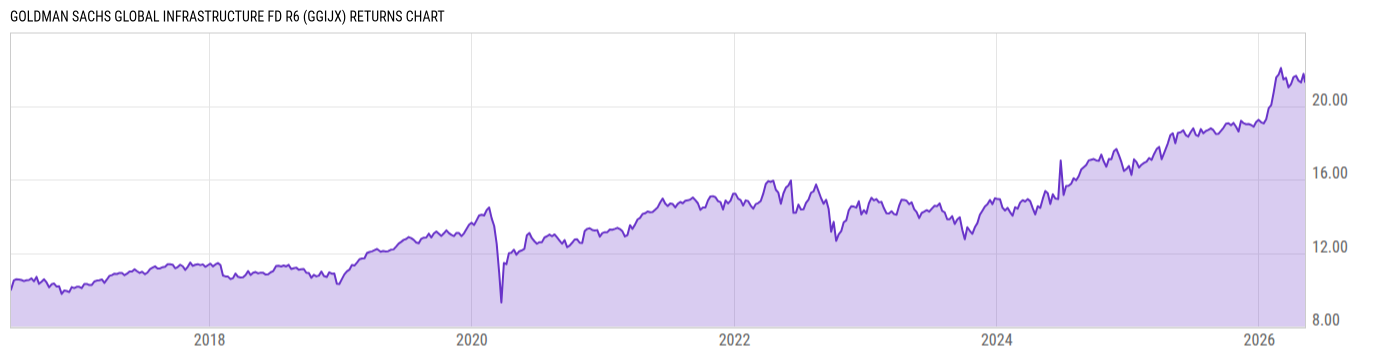
Goldman Sachs Global Infrastructure Fd R6 (GGIJX)
14.21
-0.12
(-0.84%)
USD |
May 29 2026
Returns Chart
Key Stats
| Net Expense Ratio | Total Assets Under Management | Weighted Average Dividend Yield | Turnover Ratio (Generic) |
|---|---|---|---|
| 0.96% | 133.35M | 3.00% | 19.00% |
| 1 Year Fund Level Flows | 1 Year Total Returns (Daily) | Annualized Total Returns Since Inception (Daily) | Max Drawdown (Since Inception) |
| 18.98M | 14.67% |
Basic Info
| Investment Strategy | |
| The Fund seeks total return comprised of long-term growth of capital and income. The Fund invests, under normal circumstances, at least 80% of its net assets plus any borrowings for investment purposes in a portfolio of investments in issuers that are engaged in or related to the infrastructure group of industries. |
| General | |
| Security Type | Mutual Fund |
| Equity Style | Multi Cap Value |
| Broad Asset Class | Sector Equity |
| Broad Category | Equity |
| Global Peer Group | Equity Theme - Infrastructure |
| Peer Group | Global Infrastructure Funds |
| Global Macro | Equity Theme |
| US Macro | World Sector Equity Funds |
| YCharts Categorization | -- |
| YCharts Benchmark | -- |
| Prospectus Objective | Global Infrastructure Funds |
| Fund Owner Firm Name | Goldman Sachs |
| Broad Asset Class Benchmark Index | |
| ^MSWNTR | 100.0% |
Net Fund Flows Versus Peer Group
1 Month
% Rank:
42
-20.30M
Peer Group Low
1.045B
Peer Group High
1 Year
% Rank:
50
18.98M
-139.90M
Peer Group Low
5.649B
Peer Group High
3 Months
% Rank:
50
-39.17M
Peer Group Low
2.471B
Peer Group High
3 Years
% Rank:
71
-720.62M
Peer Group Low
6.835B
Peer Group High
6 Months
% Rank:
38
-219.53M
Peer Group Low
3.826B
Peer Group High
5 Years
% Rank:
74
-917.85M
Peer Group Low
7.168B
Peer Group High
YTD
% Rank:
38
-112.57M
Peer Group Low
3.157B
Peer Group High
10 Years
% Rank:
49
-3.831B
Peer Group Low
7.476B
Peer Group High
Date Unavailable
Risk
Performance Versus Peer Group
Annual Total Returns Versus Peers
As of May 31, 2026.
Asset Allocation
As of March 31, 2026.
| Type | % Net |
|---|---|
| Cash | 1.59% |
| Stock | 98.37% |
| Bond | 0.03% |
| Convertible | 0.00% |
| Preferred | 0.00% |
| Other | 0.00% |
Top 10 Holdings
| Name | % Weight | Price | % Change |
|---|---|---|---|
| Enbridge, Inc. | 8.02% | 54.74 | -1.48% |
| National Grid Plc | 6.37% | 16.53 | -3.70% |
| American Tower Corp. | 5.45% | 186.96 | 0.15% |
| VINCI SA | 5.28% | 144.16 | 0.00% |
| Cheniere Energy, Inc. | 4.02% | 224.86 | -2.05% |
| Targa Resources Corp. | 3.95% | 255.07 | -2.69% |
| The Williams Cos., Inc. | 3.67% | 71.39 | -2.38% |
| TC Energy Corp. | 2.93% | 66.62 | -1.49% |
| PG&E Corp. | 2.90% | 16.34 | 0.31% |
| Sempra | 2.79% | 89.13 | -1.00% |
Fees & Availability
| Fees | |
| Actual 12B-1 Fee | -- |
| Actual Management Fee | 0.62% |
| Administration Fee | -- |
| Maximum Front Load | -- |
| Maximum Deferred Load | -- |
| Maximum Redemption Fee | -- |
| General Availability | |
| Available for Insurance Product | No |
| Available for RRSP | No |
| Purchase Details | |
| Open to New Investors |
|
| Minimum Initial Investment | 0.00 None |
| Minimum Subsequent Investment | 0.00 None |
Basic Info
| Investment Strategy | |
| The Fund seeks total return comprised of long-term growth of capital and income. The Fund invests, under normal circumstances, at least 80% of its net assets plus any borrowings for investment purposes in a portfolio of investments in issuers that are engaged in or related to the infrastructure group of industries. |
| General | |
| Security Type | Mutual Fund |
| Equity Style | Multi Cap Value |
| Broad Asset Class | Sector Equity |
| Broad Category | Equity |
| Global Peer Group | Equity Theme - Infrastructure |
| Peer Group | Global Infrastructure Funds |
| Global Macro | Equity Theme |
| US Macro | World Sector Equity Funds |
| YCharts Categorization | -- |
| YCharts Benchmark | -- |
| Prospectus Objective | Global Infrastructure Funds |
| Fund Owner Firm Name | Goldman Sachs |
| Broad Asset Class Benchmark Index | |
| ^MSWNTR | 100.0% |
Fundamentals
| General | |
| Distribution Yield | -- |
| Dividend Yield TTM (5-28-26) | 2.15% |
| 30-Day SEC Yield (4-30-26) | 2.04% |
| 7-Day SEC Yield | -- |
| Number of Holdings | 51 |
| Stock | |
| Weighted Average PE Ratio | 25.70 |
| Weighted Average Price to Sales Ratio | 4.249 |
| Weighted Average Price to Book Ratio | 5.028 |
| Weighted Median ROE | 16.02% |
| Weighted Median ROA | 4.28% |
| ROI (TTM) | 5.16% |
| Return on Investment (TTM) | 5.16% |
| Earning Yield | 0.0454 |
| LT Debt / Shareholders Equity | 1.717 |
| Number of Equity Holdings | 49 |
As of March 31, 2026
Growth Metrics
| EPS Growth (1Y) | 8.23% |
| EPS Growth (3Y) | 18.64% |
| EPS Growth (5Y) | 20.56% |
| Sales Growth (1Y) | 9.07% |
| Sales Growth (3Y) | 2.30% |
| Sales Growth (5Y) | 9.69% |
| Sales per Share Growth (1Y) | 6.70% |
| Sales per Share Growth (3Y) | 0.96% |
| Operating Cash Flow - Growth Rate (3Y) | 9.74% |
As of March 31, 2026
Fund Details
Top Portfolio Holders
| Name | % Weight |
|---|---|
| Portfolio A | 5.00% |
| Portfolio B | 3.50% |
| Portfolio C | 2.25% |
Excel Add-In Codes
| Name: =YCI("M:GGIJX", "name") |
| Broad Asset Class: =YCI("M:GGIJX", "broad_asset_class") |
| Broad Category: =YCI("M:GGIJX", "broad_category_group") |
| Prospectus Objective: =YCI("M:GGIJX", "prospectus_objective") |
| To find the codes for any of our securities and financial metrics, see our Complete Excel Reference. |