

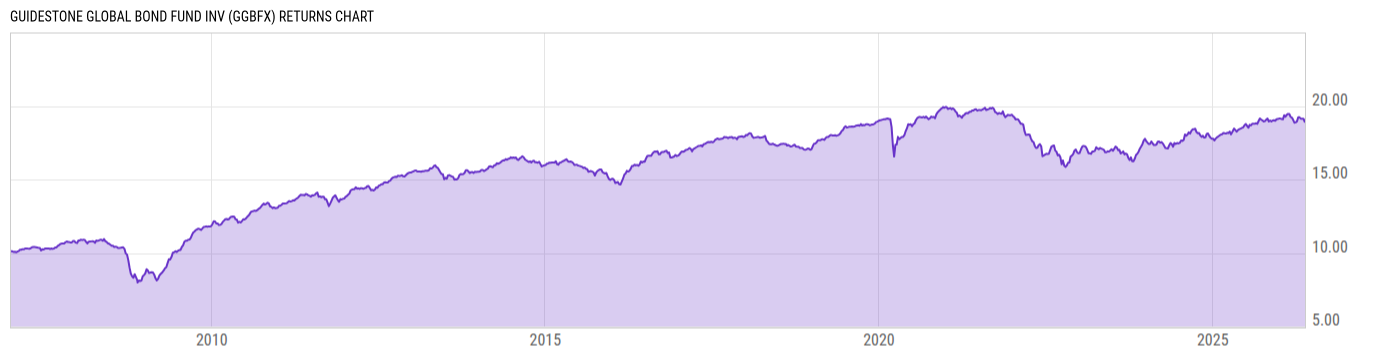
GuideStone Global Bond Fund Inv (GGBFX)
8.67
+0.01
(+0.12%)
USD |
May 21 2026
Returns Chart
Key Stats
| Net Expense Ratio | Total Assets Under Management | Weighted Average Dividend Yield | Turnover Ratio (Generic) |
|---|---|---|---|
| 0.94% | 708.91M | -- | 144.0% |
| 1 Year Fund Level Flows | 1 Year Total Returns (Daily) | Annualized Total Returns Since Inception (Daily) | Max Drawdown (Since Inception) |
| 86.08M | 3.94% |
Basic Info
| Investment Strategy | |
| The Fund seeks to maximize total return through capital gains and current income while preserving principal value. The Fund invests mainly (at least 80% of its net assets and typically more) in a diversified portfolio of fixed income instruments of varying maturities and quality across different industries and sectors. |
| General | |
| Security Type | Mutual Fund |
| Equity Style | -- |
| Broad Asset Class | Taxable Bond |
| Broad Category | Fixed Income |
| Global Peer Group | Bond Global USD |
| Peer Group | Global Income Funds |
| Global Macro | Bond Global |
| US Macro | World Income Funds |
| YCharts Categorization | -- |
| YCharts Benchmark | -- |
| Prospectus Objective | Global Income Funds |
| Fund Owner Firm Name | GuideStone Funds Trust |
| Broad Asset Class Benchmark Index | |
| ^BBUSATR | 100.0% |
Net Fund Flows Versus Peer Group
1 Month
% Rank:
20
-312.18M
Peer Group Low
211.27M
Peer Group High
1 Year
% Rank:
23
86.08M
-1.130B
Peer Group Low
1.493B
Peer Group High
3 Months
% Rank:
65
-461.90M
Peer Group Low
567.54M
Peer Group High
3 Years
% Rank:
27
-2.542B
Peer Group Low
2.711B
Peer Group High
6 Months
% Rank:
40
-771.56M
Peer Group Low
851.14M
Peer Group High
5 Years
% Rank:
15
-8.824B
Peer Group Low
3.278B
Peer Group High
YTD
% Rank:
43
-485.30M
Peer Group Low
617.06M
Peer Group High
10 Years
% Rank:
33
-48.28B
Peer Group Low
4.453B
Peer Group High
Date Unavailable
Risk
Performance Versus Peer Group
Annual Total Returns Versus Peers
As of May 22, 2026.
Asset Allocation
As of March 31, 2026.
| Type | % Net |
|---|---|
| Cash | -11.92% |
| Stock | 0.00% |
| Bond | 96.99% |
| Convertible | 0.00% |
| Preferred | 0.00% |
| Other | 14.92% |
Top 10 Holdings
| Name | % Weight | Price | % Change |
|---|---|---|---|
|
US T BONDS JUN26
|
17.61% | -- | -- |
|
2YR T-NOTE JUN26
|
6.85% | -- | -- |
| GuideStone Money Market Fund Inst | 4.60% | 1.00 | 0.00% |
| United States of America USGB 4.0 03/31/2030 FIX USD Government | 1.28% | 99.24 | -0.13% |
|
Korea, Republic of (Government) 2.5% 10-SEP-2030
|
1.24% | -- | -- |
|
Spain, Kingdom of (Government) 30-JUL-2039
|
1.21% | -- | -- |
|
2 YR BOND JUN6
|
1.16% | -- | -- |
| Canada CAN 1.5 12/01/2031 FIX CAD Government | 1.06% | 91.45 | 0.26% |
|
SCHATZ 6% JUN6
|
1.04% | -- | -- |
|
United Kingdom of Great Britain and Northern Ireland (Government) 4% 22-OCT-2031
|
1.01% | -- | -- |
Fees & Availability
| Fees | |
| Actual 12B-1 Fee | -- |
| Actual Management Fee | 0.47% |
| Administration Fee | 19.45K% |
| Maximum Front Load | -- |
| Maximum Deferred Load | -- |
| Maximum Redemption Fee | -- |
| General Availability | |
| Available for Insurance Product | No |
| Available for RRSP | No |
| Purchase Details | |
| Open to New Investors |
|
| Minimum Initial Investment | 1000.00 None |
| Minimum Subsequent Investment | 100.00 None |
Basic Info
| Investment Strategy | |
| The Fund seeks to maximize total return through capital gains and current income while preserving principal value. The Fund invests mainly (at least 80% of its net assets and typically more) in a diversified portfolio of fixed income instruments of varying maturities and quality across different industries and sectors. |
| General | |
| Security Type | Mutual Fund |
| Equity Style | -- |
| Broad Asset Class | Taxable Bond |
| Broad Category | Fixed Income |
| Global Peer Group | Bond Global USD |
| Peer Group | Global Income Funds |
| Global Macro | Bond Global |
| US Macro | World Income Funds |
| YCharts Categorization | -- |
| YCharts Benchmark | -- |
| Prospectus Objective | Global Income Funds |
| Fund Owner Firm Name | GuideStone Funds Trust |
| Broad Asset Class Benchmark Index | |
| ^BBUSATR | 100.0% |
Fundamentals
| General | |
| Distribution Yield | -- |
| Dividend Yield TTM (5-20-26) | 3.08% |
| 30-Day SEC Yield (3-31-26) | 4.33% |
| 7-Day SEC Yield | -- |
| Number of Holdings | 1739 |
| Bond | |
| Yield to Maturity (3-31-26) | 5.24% |
| Effective Duration | 5.47 |
| Average Coupon | 5.03% |
| Calculated Average Quality | 3.669 |
| Effective Maturity | 11.08 |
| Nominal Maturity | 11.26 |
| Number of Bond Holdings | 1526 |
As of March 31, 2026
Fund Details
| Key Dates | |
| Inception Date | 12/29/2006 |
| Last Annual Report Date | 12/31/2025 |
| Last Prospectus Date | 5/1/2025 |
| Share Classes | |
| GGBEX | Inst |
| Attributes | |
| Index Fund | -- |
| Inverse Fund | No |
| Leveraged Fund | -- |
| Fund of Funds | No |
| Currency Hedged Fund | -- |
| Socially Responsible Fund | No |
Top Portfolio Holders
| Name | % Weight |
|---|---|
| Portfolio A | 5.00% |
| Portfolio B | 3.50% |
| Portfolio C | 2.25% |
Excel Add-In Codes
| Name: =YCI("M:GGBFX", "name") |
| Broad Asset Class: =YCI("M:GGBFX", "broad_asset_class") |
| Broad Category: =YCI("M:GGBFX", "broad_category_group") |
| Prospectus Objective: =YCI("M:GGBFX", "prospectus_objective") |
| To find the codes for any of our securities and financial metrics, see our Complete Excel Reference. |