

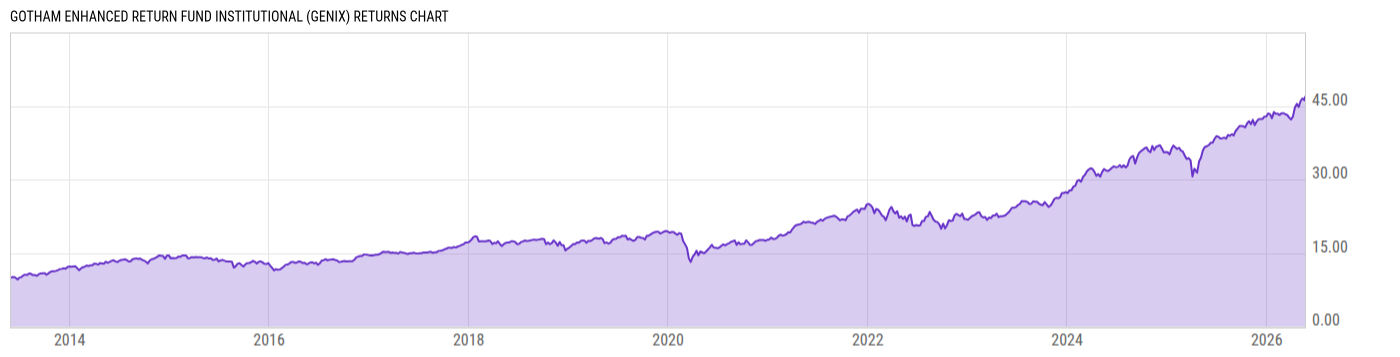
Gotham Enhanced Return Fund Institutional (GENIX)
16.30
0.00 (0.00%)
USD |
Jun 09 2026
Returns Chart
Key Stats
| Net Expense Ratio | Total Assets Under Management | Weighted Average Dividend Yield | Turnover Ratio (Generic) |
|---|---|---|---|
| 1.51% | 479.27M | -- | 153.0% |
| 1 Year Fund Level Flows | 1 Year Total Returns (Daily) | Annualized Total Returns Since Inception (Daily) | Max Drawdown (Since Inception) |
| 50.99M | 26.27% |
Basic Info
| Investment Strategy | |
| The Fund seeks to provide long-term capital appreciation. The Fund invests in long and short positions of equity and equity-related securities. The Fund seeks a total return greater than that of the S&P 500 Index over a full market cycle which is a period that includes both a bull market and a bear market cycle. |
| General | |
| Security Type | Mutual Fund |
| Equity Style | -- |
| Broad Asset Class | Alternative |
| Broad Category | Alternative Strategies |
| Global Peer Group | Alternative Long/Short Equity US |
| Peer Group | Alternative Long/Short Equity Funds |
| Global Macro | Alternative Equity |
| US Macro | Alternative Equity Funds |
| YCharts Categorization | -- |
| YCharts Benchmark | -- |
| Prospectus Objective | Alternative Long/Short Equity Funds |
| Fund Owner Firm Name | Gotham Funds |
| Broad Asset Class Benchmark Index | |
| ^MSACWINTR | 100.0% |
Net Fund Flows Versus Peer Group
1 Month
% Rank:
85
-598.12M
Peer Group Low
823.99M
Peer Group High
1 Year
% Rank:
25
50.99M
-248.79M
Peer Group Low
5.532B
Peer Group High
3 Months
% Rank:
34
-722.58M
Peer Group Low
2.242B
Peer Group High
3 Years
% Rank:
25
-583.32M
Peer Group Low
9.347B
Peer Group High
6 Months
% Rank:
26
-455.92M
Peer Group Low
3.568B
Peer Group High
5 Years
% Rank:
35
-954.50M
Peer Group Low
9.538B
Peer Group High
YTD
% Rank:
28
-441.75M
Peer Group Low
3.346B
Peer Group High
10 Years
% Rank:
94
-6.742B
Peer Group Low
8.592B
Peer Group High
Date Unavailable
Risk
Performance Versus Peer Group
Annual Total Returns Versus Peers
As of June 10, 2026.
Asset Allocation
As of December 31, 2025.
| Type | % Net |
|---|---|
| Cash | 6.79% |
| Stock | 74.06% |
| Bond | 3.23% |
| Convertible | 0.00% |
| Preferred | 0.00% |
| Other | 15.92% |
Top 10 Holdings
| Name | % Weight | Price | % Change |
|---|---|---|---|
| Gotham Enhanced 500 ETF | 21.11% | 40.10 | -0.25% |
| Gotham 1000 Value ETF | 19.97% | 26.45 | 0.66% |
| BNY Dreyfus Government Cash Management Instl | 5.86% | 1.00 | 0.00% |
|
Cash and Cash Equivalents
|
4.03% | -- | -- |
| State Street SPDR S&P 500 ETF Trust | 2.06% | 725.69 | -1.54% |
| Western Digital Corp. | 0.81% | 490.24 | -5.31% |
|
Morgan Stanley & Co LLC/Centrus Energy Corp TRS
|
0.76% | -- | -- |
|
Morgan Stanley & Co LLC/Western Digital Corp TRS
|
0.65% | -- | -- |
| Microsoft Corp. | 0.63% | 397.35 | -1.50% |
|
Morgan Stanley & Co LLC/Seagate Technology Holdings Plc TRS
|
0.54% | -- | -- |
Fees & Availability
| Fees | |
| Actual 12B-1 Fee | -- |
| Actual Management Fee | 1.06% |
| Administration Fee | 164.3K% |
| Maximum Front Load | -- |
| Maximum Deferred Load | -- |
| Maximum Redemption Fee | 1.00% |
| General Availability | |
| Available for Insurance Product | No |
| Available for RRSP | No |
| Purchase Details | |
| Open to New Investors |
|
| Minimum Initial Investment | 100000.0 None |
| Minimum Subsequent Investment | 250.00 None |
Basic Info
| Investment Strategy | |
| The Fund seeks to provide long-term capital appreciation. The Fund invests in long and short positions of equity and equity-related securities. The Fund seeks a total return greater than that of the S&P 500 Index over a full market cycle which is a period that includes both a bull market and a bear market cycle. |
| General | |
| Security Type | Mutual Fund |
| Equity Style | -- |
| Broad Asset Class | Alternative |
| Broad Category | Alternative Strategies |
| Global Peer Group | Alternative Long/Short Equity US |
| Peer Group | Alternative Long/Short Equity Funds |
| Global Macro | Alternative Equity |
| US Macro | Alternative Equity Funds |
| YCharts Categorization | -- |
| YCharts Benchmark | -- |
| Prospectus Objective | Alternative Long/Short Equity Funds |
| Fund Owner Firm Name | Gotham Funds |
| Broad Asset Class Benchmark Index | |
| ^MSACWINTR | 100.0% |
Fundamentals
| General | |
| Distribution Yield | -- |
| Dividend Yield TTM (6-8-26) | 0.09% |
| 30-Day SEC Yield | -- |
| 7-Day SEC Yield | -- |
| Number of Holdings | 1792 |
| Stock | |
| Weighted Average PE Ratio | 27.48 |
| Weighted Average Price to Sales Ratio | 5.214 |
| Weighted Average Price to Book Ratio | 7.504 |
| Weighted Median ROE | 89.92% |
| Weighted Median ROA | 11.21% |
| ROI (TTM) | 21.10% |
| Return on Investment (TTM) | 21.10% |
| Earning Yield | 0.0499 |
| LT Debt / Shareholders Equity | 1.305 |
| Number of Equity Holdings | 597 |
As of December 31, 2025
Growth Metrics
| EPS Growth (1Y) | 25.11% |
| EPS Growth (3Y) | 13.40% |
| EPS Growth (5Y) | 16.60% |
| Sales Growth (1Y) | 11.94% |
| Sales Growth (3Y) | 9.48% |
| Sales Growth (5Y) | 11.00% |
| Sales per Share Growth (1Y) | 22.15% |
| Sales per Share Growth (3Y) | 10.19% |
| Operating Cash Flow - Growth Rate (3Y) | 15.85% |
As of December 31, 2025
Fund Details
| Key Dates | |
| Inception Date | 5/31/2013 |
| Last Annual Report Date | 9/30/2025 |
| Last Prospectus Date | 2/1/2026 |
| Attributes | |
| Index Fund | -- |
| Inverse Fund | No |
| Leveraged Fund | -- |
| Fund of Funds | No |
| Currency Hedged Fund | -- |
| Socially Responsible Fund | No |
Top Portfolio Holders
| Name | % Weight |
|---|---|
| Portfolio A | 5.00% |
| Portfolio B | 3.50% |
| Portfolio C | 2.25% |
Excel Add-In Codes
| Name: =YCI("M:GENIX", "name") |
| Broad Asset Class: =YCI("M:GENIX", "broad_asset_class") |
| Broad Category: =YCI("M:GENIX", "broad_category_group") |
| Prospectus Objective: =YCI("M:GENIX", "prospectus_objective") |
| To find the codes for any of our securities and financial metrics, see our Complete Excel Reference. |