

GuideStone Defensive Market Strategies Inst (GDMYX)
12.42
-0.05
(-0.40%)
USD |
Jun 03 2026
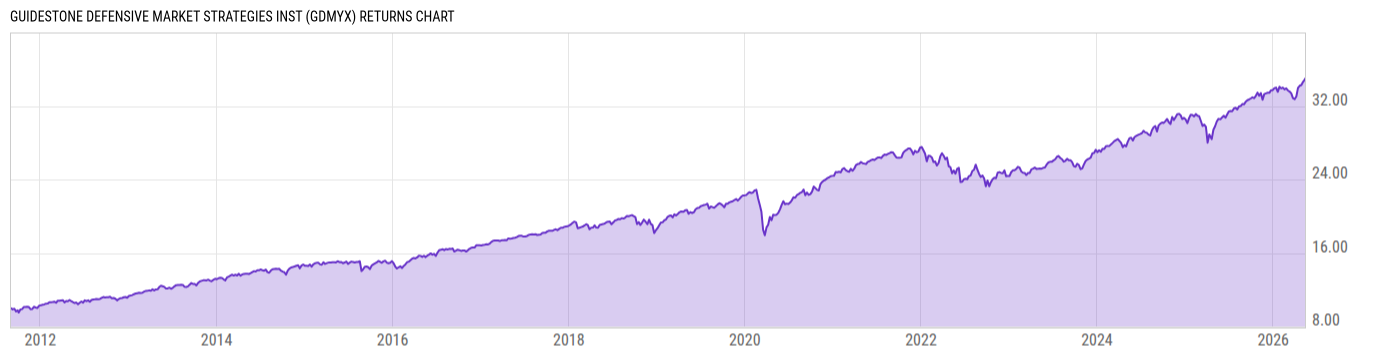
Returns Chart
Key Stats
| Net Expense Ratio | Total Assets Under Management | Weighted Average Dividend Yield | Turnover Ratio (Generic) |
|---|---|---|---|
| 0.65% | 1.287B | -- | 68.00% |
| 1 Year Fund Level Flows | 1 Year Total Returns (Daily) | Annualized Total Returns Since Inception (Daily) | Max Drawdown (Since Inception) |
| -265.28M | 15.58% |
Basic Info
| Investment Strategy | |
| The Fund seeks to provide long-term capital appreciation with reduced volatility compared to the equity markets. The principal strategies, when combined, are intended to result in the Fund obtaining investment returns consistent with the equity market, but with lower volatility when compared to the broader equity market. |
| General | |
| Security Type | Mutual Fund |
| Equity Style | -- |
| Broad Asset Class | Allocation |
| Broad Category | Allocation |
| Global Peer Group | Mixed Asset USD Flexible - US |
| Peer Group | Flexible Portfolio Funds |
| Global Macro | Mixed Asset HC Flexible |
| US Macro | Mixed-Assets Funds |
| YCharts Categorization | -- |
| YCharts Benchmark | -- |
| Prospectus Objective | Flexible Portfolio Funds |
| Fund Owner Firm Name | GuideStone Funds Trust |
| Broad Asset Class Benchmark Index | |
| ^SPXTR | 100.0% |
Net Fund Flows Versus Peer Group
1 Month
% Rank:
59
-133.15M
Peer Group Low
1.148B
Peer Group High
1 Year
% Rank:
90
-265.28M
-3.214B
Peer Group Low
10.19B
Peer Group High
3 Months
% Rank:
14
-582.29M
Peer Group Low
10.19B
Peer Group High
3 Years
% Rank:
82
-12.12B
Peer Group Low
10.19B
Peer Group High
6 Months
% Rank:
34
-1.396B
Peer Group Low
10.19B
Peer Group High
5 Years
% Rank:
84
-14.74B
Peer Group Low
10.19B
Peer Group High
YTD
% Rank:
26
-927.39M
Peer Group Low
10.19B
Peer Group High
10 Years
% Rank:
77
-47.38B
Peer Group Low
12.34B
Peer Group High
Date Unavailable
Risk
Performance Versus Peer Group
Annual Total Returns Versus Peers
As of June 04, 2026.
Asset Allocation
As of March 31, 2026.
| Type | % Net |
|---|---|
| Cash | -10.73% |
| Stock | 20.43% |
| Bond | 71.96% |
| Convertible | 0.00% |
| Preferred | 0.07% |
| Other | 18.27% |
Top 10 Holdings
| Name | % Weight | Price | % Change |
|---|---|---|---|
| United States of America USGB 0.0 06/30/2026 FIX USD Government | 16.79% | 99.75 | 0.01% |
| United States of America USGB 4.375 12/15/2026 FIX USD Government | 9.13% | 100.34 | -0.00% |
| United States of America USGB 4.25 03/15/2027 FIX USD Government | 9.11% | 100.33 | 0.01% |
| United States of America USGB 4.625 09/15/2026 FIX USD Government | 8.36% | 100.25 | 0.01% |
|
US T BONDS JUN26
|
7.70% | -- | -- |
| United States of America USGB 4.125 06/15/2026 FIX USD Government | 7.61% | 100.01 | -0.00% |
| GuideStone Money Market Fund Inst | 7.55% | 1.00 | 0.00% |
|
2YR T-NOTE JUN26
|
4.66% | -- | -- |
| United States of America USGB 0.75 01/31/2028 FIX USD Government | 3.53% | 94.77 | 0.05% |
|
S&P 500 Index Future
|
2.77% | -- | -- |
Fees & Availability
| Fees | |
| Actual 12B-1 Fee | -- |
| Actual Management Fee | 0.59% |
| Administration Fee | 189.9K% |
| Maximum Front Load | -- |
| Maximum Deferred Load | -- |
| Maximum Redemption Fee | -- |
| General Availability | |
| Available for Insurance Product | No |
| Available for RRSP | No |
| Purchase Details | |
| Open to New Investors |
|
| Minimum Initial Investment | 1.00M None |
| Minimum Subsequent Investment | 0.00 None |
Basic Info
| Investment Strategy | |
| The Fund seeks to provide long-term capital appreciation with reduced volatility compared to the equity markets. The principal strategies, when combined, are intended to result in the Fund obtaining investment returns consistent with the equity market, but with lower volatility when compared to the broader equity market. |
| General | |
| Security Type | Mutual Fund |
| Equity Style | -- |
| Broad Asset Class | Allocation |
| Broad Category | Allocation |
| Global Peer Group | Mixed Asset USD Flexible - US |
| Peer Group | Flexible Portfolio Funds |
| Global Macro | Mixed Asset HC Flexible |
| US Macro | Mixed-Assets Funds |
| YCharts Categorization | -- |
| YCharts Benchmark | -- |
| Prospectus Objective | Flexible Portfolio Funds |
| Fund Owner Firm Name | GuideStone Funds Trust |
| Broad Asset Class Benchmark Index | |
| ^SPXTR | 100.0% |
Fundamentals
| General | |
| Distribution Yield | -- |
| Dividend Yield TTM (6-2-26) | 2.21% |
| 30-Day SEC Yield | -- |
| 7-Day SEC Yield | -- |
| Number of Holdings | 208 |
| Stock | |
| Weighted Average PE Ratio | 30.60 |
| Weighted Average Price to Sales Ratio | 7.586 |
| Weighted Average Price to Book Ratio | 11.02 |
| Weighted Median ROE | 48.86% |
| Weighted Median ROA | 13.27% |
| ROI (TTM) | 20.10% |
| Return on Investment (TTM) | 20.10% |
| Earning Yield | 0.0373 |
| LT Debt / Shareholders Equity | 0.8523 |
| Number of Equity Holdings | 35 |
| Bond | |
| Yield to Maturity (3-31-26) | 3.25% |
| Effective Duration | -- |
| Average Coupon | 3.71% |
| Calculated Average Quality | 2.131 |
| Effective Maturity | 1.210 |
| Nominal Maturity | 1.210 |
| Number of Bond Holdings | 133 |
As of March 31, 2026
Growth Metrics
| EPS Growth (1Y) | 16.96% |
| EPS Growth (3Y) | 10.93% |
| EPS Growth (5Y) | 21.30% |
| Sales Growth (1Y) | 11.48% |
| Sales Growth (3Y) | 8.78% |
| Sales Growth (5Y) | 10.85% |
| Sales per Share Growth (1Y) | 12.88% |
| Sales per Share Growth (3Y) | 10.04% |
| Operating Cash Flow - Growth Rate (3Y) | 9.70% |
As of March 31, 2026
Fund Details
| Key Dates | |
| Inception Date | 9/1/2011 |
| Last Annual Report Date | 12/31/2025 |
| Last Prospectus Date | 5/1/2025 |
| Share Classes | |
| GDMZX | Inv |
| Attributes | |
| Index Fund | -- |
| Inverse Fund | No |
| Leveraged Fund | -- |
| Fund of Funds | No |
| Currency Hedged Fund | -- |
| Socially Responsible Fund | No |
Top Portfolio Holders
| Name | % Weight |
|---|---|
| Portfolio A | 5.00% |
| Portfolio B | 3.50% |
| Portfolio C | 2.25% |
Excel Add-In Codes
| Name: =YCI("M:GDMYX", "name") |
| Broad Asset Class: =YCI("M:GDMYX", "broad_asset_class") |
| Broad Category: =YCI("M:GDMYX", "broad_category_group") |
| Prospectus Objective: =YCI("M:GDMYX", "prospectus_objective") |
| To find the codes for any of our securities and financial metrics, see our Complete Excel Reference. |