

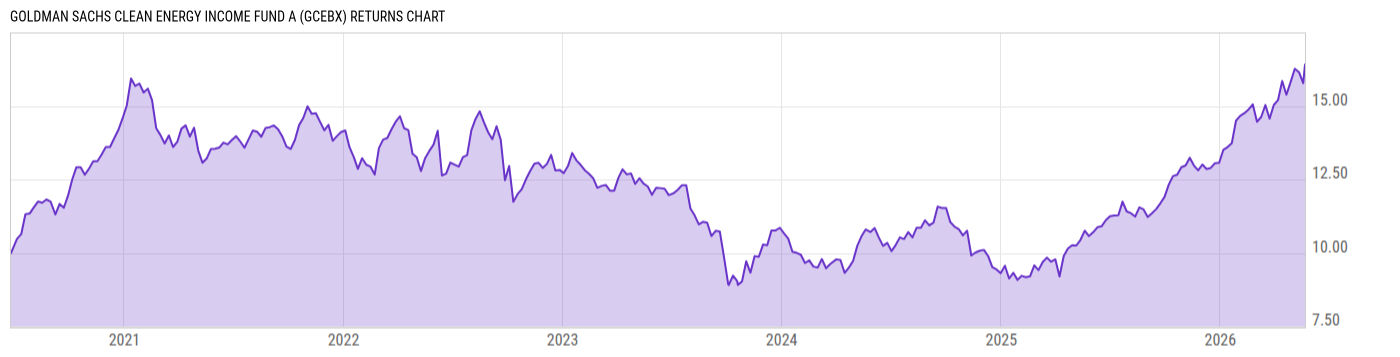
Goldman Sachs Clean Energy Income Fund A (GCEBX)
13.49
-0.09
(-0.66%)
USD |
Jun 09 2026
Returns Chart
Key Stats
| Net Expense Ratio | Total Assets Under Management | Weighted Average Dividend Yield | Turnover Ratio (Generic) |
|---|---|---|---|
| 1.26% | 41.76M | 1.94% | 23.00% |
| 1 Year Fund Level Flows | 1 Year Total Returns (Daily) | Annualized Total Returns Since Inception (Daily) | Max Drawdown (Since Inception) |
| -9.400M | 46.06% |
Basic Info
| Investment Strategy | |
| The Fund seeks total return through current income and capital appreciation. The Fund invests, under normal circumstances, at least 80% of its net assets plus any borrowings for investment purposes measured at the time of purchase, in U.S. and non-U.S. equity securities issued by clean energy companies. |
| General | |
| Security Type | Mutual Fund |
| Equity Style | Multi Cap Value |
| Broad Asset Class | Sector Equity |
| Broad Category | Equity |
| Global Peer Group | Equity Theme - Alternative Energy |
| Peer Group | Alternative Energy Funds |
| Global Macro | Equity Theme |
| US Macro | Sector Equity Funds |
| YCharts Categorization | -- |
| YCharts Benchmark | -- |
| Prospectus Objective | Alternative Energy Funds |
| Fund Owner Firm Name | Goldman Sachs |
| Broad Asset Class Benchmark Index | |
| ^MSWNTR | 100.0% |
Net Fund Flows Versus Peer Group
1 Month
% Rank:
52
-76.14M
Peer Group Low
335.71M
Peer Group High
1 Year
% Rank:
80
-9.400M
-71.53M
Peer Group Low
3.040B
Peer Group High
3 Months
% Rank:
92
-110.98M
Peer Group Low
471.18M
Peer Group High
3 Years
% Rank:
87
-1.298B
Peer Group Low
4.102B
Peer Group High
6 Months
% Rank:
92
-239.41M
Peer Group Low
1.182B
Peer Group High
5 Years
% Rank:
85
-1.777B
Peer Group Low
4.133B
Peer Group High
YTD
% Rank:
90
-258.73M
Peer Group Low
1.084B
Peer Group High
10 Years
% Rank:
47
-53.62M
Peer Group Low
4.111B
Peer Group High
Date Unavailable
Risk
Performance Versus Peer Group
Annual Total Returns Versus Peers
As of June 10, 2026.
Asset Allocation
As of February 28, 2026.
| Type | % Net |
|---|---|
| Cash | 0.62% |
| Stock | 98.23% |
| Bond | 0.08% |
| Convertible | 0.00% |
| Preferred | 0.00% |
| Other | 1.08% |
Top 10 Holdings
| Name | % Weight | Price | % Change |
|---|---|---|---|
| RWE AG | 8.74% | 64.78 | -1.01% |
| SSE Plc | 8.12% | 30.97 | -1.84% |
| EDP SA | 5.87% | 5.005 | 0.30% |
| Bloom Energy Corp. | 4.79% | 234.84 | -9.54% |
| Iberdrola SA | 4.71% | 23.01 | 0.00% |
| TERNA Rete Elettrica Nazionale SpA | 4.35% | 11.70 | 0.00% |
| Ørsted A/S | 4.07% | 25.00 | 3.86% |
| Ormat Technologies, Inc. | 3.84% | 137.00 | -0.85% |
| First Solar, Inc. | 3.75% | 250.72 | -4.37% |
| Nextpower, Inc. | 3.66% | 111.62 | -6.41% |
Fees & Availability
| Fees | |
| Actual 12B-1 Fee | 0.25% |
| Actual Management Fee | 0.26% |
| Administration Fee | -- |
| Maximum Front Load | 5.50% |
| Maximum Deferred Load | -- |
| Maximum Redemption Fee | -- |
| General Availability | |
| Available for Insurance Product | No |
| Available for RRSP | No |
| Purchase Details | |
| Open to New Investors |
|
| Minimum Initial Investment | 1000.00 None |
| Minimum Subsequent Investment | 50.00 None |
Basic Info
| Investment Strategy | |
| The Fund seeks total return through current income and capital appreciation. The Fund invests, under normal circumstances, at least 80% of its net assets plus any borrowings for investment purposes measured at the time of purchase, in U.S. and non-U.S. equity securities issued by clean energy companies. |
| General | |
| Security Type | Mutual Fund |
| Equity Style | Multi Cap Value |
| Broad Asset Class | Sector Equity |
| Broad Category | Equity |
| Global Peer Group | Equity Theme - Alternative Energy |
| Peer Group | Alternative Energy Funds |
| Global Macro | Equity Theme |
| US Macro | Sector Equity Funds |
| YCharts Categorization | -- |
| YCharts Benchmark | -- |
| Prospectus Objective | Alternative Energy Funds |
| Fund Owner Firm Name | Goldman Sachs |
| Broad Asset Class Benchmark Index | |
| ^MSWNTR | 100.0% |
Fundamentals
| General | |
| Distribution Yield | -- |
| Dividend Yield TTM (6-8-26) | 1.17% |
| 30-Day SEC Yield (4-30-26) | 0.71% |
| 7-Day SEC Yield | -- |
| Number of Holdings | 43 |
| Stock | |
| Weighted Average PE Ratio | 27.54 |
| Weighted Average Price to Sales Ratio | 4.044 |
| Weighted Average Price to Book Ratio | 3.744 |
| Weighted Median ROE | 8.44% |
| Weighted Median ROA | 3.27% |
| ROI (TTM) | 4.47% |
| Return on Investment (TTM) | 4.47% |
| Earning Yield | 0.0436 |
| LT Debt / Shareholders Equity | 1.088 |
| Number of Equity Holdings | 39 |
As of February 28, 2026
Growth Metrics
| EPS Growth (1Y) | 15.76% |
| EPS Growth (3Y) | 13.10% |
| EPS Growth (5Y) | 5.80% |
| Sales Growth (1Y) | 5.80% |
| Sales Growth (3Y) | 5.60% |
| Sales Growth (5Y) | 9.79% |
| Sales per Share Growth (1Y) | 3.67% |
| Sales per Share Growth (3Y) | 1.65% |
| Operating Cash Flow - Growth Rate (3Y) | 24.84% |
As of February 28, 2026
Fund Details
Top Portfolio Holders
| Name | % Weight |
|---|---|
| Portfolio A | 5.00% |
| Portfolio B | 3.50% |
| Portfolio C | 2.25% |
Excel Add-In Codes
| Name: =YCI("M:GCEBX", "name") |
| Broad Asset Class: =YCI("M:GCEBX", "broad_asset_class") |
| Broad Category: =YCI("M:GCEBX", "broad_category_group") |
| Prospectus Objective: =YCI("M:GCEBX", "prospectus_objective") |
| To find the codes for any of our securities and financial metrics, see our Complete Excel Reference. |