

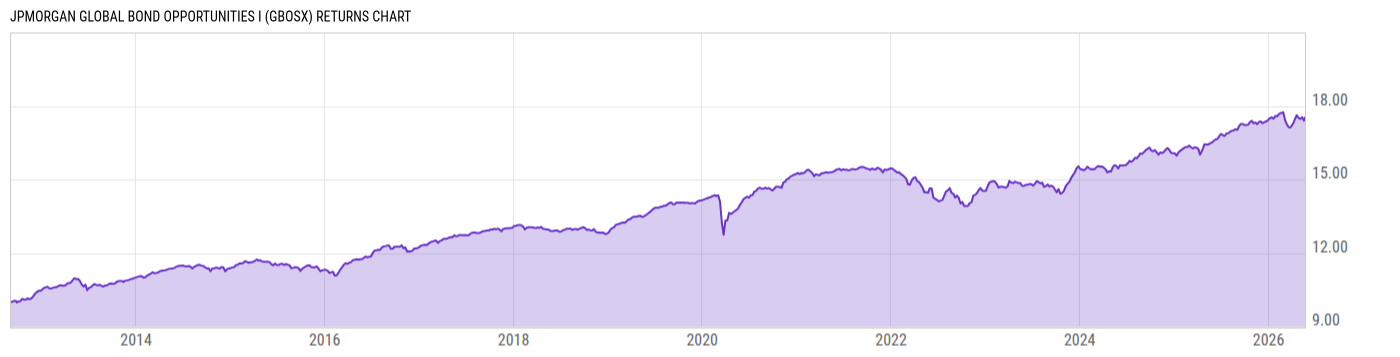
JPMorgan Global Bond Opportunities I (GBOSX)
9.79
+0.02
(+0.20%)
USD |
May 22 2026
Returns Chart
Key Stats
| Net Expense Ratio | Total Assets Under Management | Weighted Average Dividend Yield | Turnover Ratio (Generic) |
|---|---|---|---|
| 0.64% | 4.136B | -- | 111.0% |
| 1 Year Fund Level Flows | 1 Year Total Returns (Daily) | Annualized Total Returns Since Inception (Daily) | Max Drawdown (Since Inception) |
| 321.45M | 6.59% |
Basic Info
| Investment Strategy | |
| The Fund seeks to to provide total return. The Fund invests across sectors in developed and emerging markets located around the world. Under normal circumstances, the Fund will invest at least 80% of its assets in bonds. The Fund will invest at least 40% of its total assets in countries other than the United States. |
| General | |
| Security Type | Mutual Fund |
| Equity Style | -- |
| Broad Asset Class | Taxable Bond |
| Broad Category | Fixed Income |
| Global Peer Group | Bond Global USD |
| Peer Group | Global Income Funds |
| Global Macro | Bond Global |
| US Macro | World Income Funds |
| YCharts Categorization | -- |
| YCharts Benchmark | -- |
| Prospectus Objective | Global Income Funds |
| Fund Owner Firm Name | J.P. Morgan Asset Management |
| Broad Asset Class Benchmark Index | |
| ^BBUSATR | 100.0% |
Net Fund Flows Versus Peer Group
1 Month
% Rank:
68
-312.18M
Peer Group Low
211.27M
Peer Group High
1 Year
% Rank:
13
321.45M
-1.130B
Peer Group Low
1.493B
Peer Group High
3 Months
% Rank:
12
-461.90M
Peer Group Low
567.54M
Peer Group High
3 Years
% Rank:
16
-2.542B
Peer Group Low
2.711B
Peer Group High
6 Months
% Rank:
12
-771.56M
Peer Group Low
851.14M
Peer Group High
5 Years
% Rank:
62
-8.824B
Peer Group Low
3.278B
Peer Group High
YTD
% Rank:
10
-485.30M
Peer Group Low
617.06M
Peer Group High
10 Years
% Rank:
6
-48.28B
Peer Group Low
4.453B
Peer Group High
Date Unavailable
Risk
Performance Versus Peer Group
Annual Total Returns Versus Peers
As of May 24, 2026.
Asset Allocation
As of March 31, 2026.
| Type | % Net |
|---|---|
| Cash | 11.86% |
| Stock | 0.12% |
| Bond | 89.00% |
| Convertible | 0.00% |
| Preferred | 0.01% |
| Other | -0.99% |
Top 10 Holdings
| Name | % Weight | Price | % Change |
|---|---|---|---|
| JPMorgan Prime Money Market Fund Institutional | 9.94% | 1.000 | 0.00% |
|
Government National Mortgage Association 2 5.5% 01-APR-2056
|
2.52% | -- | -- |
|
Government National Mortgage Association 2 5% 01-APR-2056
|
2.20% | -- | -- |
| United States of America USGB 3.875 03/31/2028 FIX USD Government | 1.83% | 99.57 | -0.09% |
| GNMA 4.0 08/20/2052 FIX USD Agency | 1.76% | 92.84 | 0.13% |
| Canada CAN 3.25 06/01/2035 FIX CAD Government | 1.68% | 98.09 | 0.09% |
|
Brazil, Federative Republic of (Government) 10% 01-JAN-2031
|
1.48% | -- | -- |
|
United Mexican States (Mexico) (Government) 8.5% 28-FEB-2030
|
1.28% | -- | -- |
|
South Africa, Republic of (Government) 9% 31-JAN-2040
|
1.27% | -- | -- |
|
Federal National Mortgage Association 01-NOV-2055 MA5879
|
1.16% | -- | -- |
Fees & Availability
| Fees | |
| Actual 12B-1 Fee | -- |
| Actual Management Fee | 0.28% |
| Administration Fee | 1.41M% |
| Maximum Front Load | -- |
| Maximum Deferred Load | -- |
| Maximum Redemption Fee | -- |
| General Availability | |
| Available for Insurance Product | No |
| Available for RRSP | No |
| Purchase Details | |
| Open to New Investors |
|
| Minimum Initial Investment | 1.00M None |
| Minimum Subsequent Investment | 0.00 None |
Basic Info
| Investment Strategy | |
| The Fund seeks to to provide total return. The Fund invests across sectors in developed and emerging markets located around the world. Under normal circumstances, the Fund will invest at least 80% of its assets in bonds. The Fund will invest at least 40% of its total assets in countries other than the United States. |
| General | |
| Security Type | Mutual Fund |
| Equity Style | -- |
| Broad Asset Class | Taxable Bond |
| Broad Category | Fixed Income |
| Global Peer Group | Bond Global USD |
| Peer Group | Global Income Funds |
| Global Macro | Bond Global |
| US Macro | World Income Funds |
| YCharts Categorization | -- |
| YCharts Benchmark | -- |
| Prospectus Objective | Global Income Funds |
| Fund Owner Firm Name | J.P. Morgan Asset Management |
| Broad Asset Class Benchmark Index | |
| ^BBUSATR | 100.0% |
Fundamentals
| General | |
| Distribution Yield | -- |
| Dividend Yield TTM (5-21-26) | 5.30% |
| 30-Day SEC Yield (4-30-26) | 4.98% |
| 7-Day SEC Yield | -- |
| Number of Holdings | 1455 |
| Bond | |
| Yield to Maturity (3-31-26) | 5.74% |
| Effective Duration | 4.95 |
| Average Coupon | 5.95% |
| Calculated Average Quality | 4.102 |
| Effective Maturity | 10.06 |
| Nominal Maturity | 12.34 |
| Number of Bond Holdings | 1344 |
As of March 31, 2026
Fund Details
Top Portfolio Holders
| Name | % Weight |
|---|---|
| Portfolio A | 5.00% |
| Portfolio B | 3.50% |
| Portfolio C | 2.25% |
Excel Add-In Codes
| Name: =YCI("M:GBOSX", "name") |
| Broad Asset Class: =YCI("M:GBOSX", "broad_asset_class") |
| Broad Category: =YCI("M:GBOSX", "broad_category_group") |
| Prospectus Objective: =YCI("M:GBOSX", "prospectus_objective") |
| To find the codes for any of our securities and financial metrics, see our Complete Excel Reference. |