

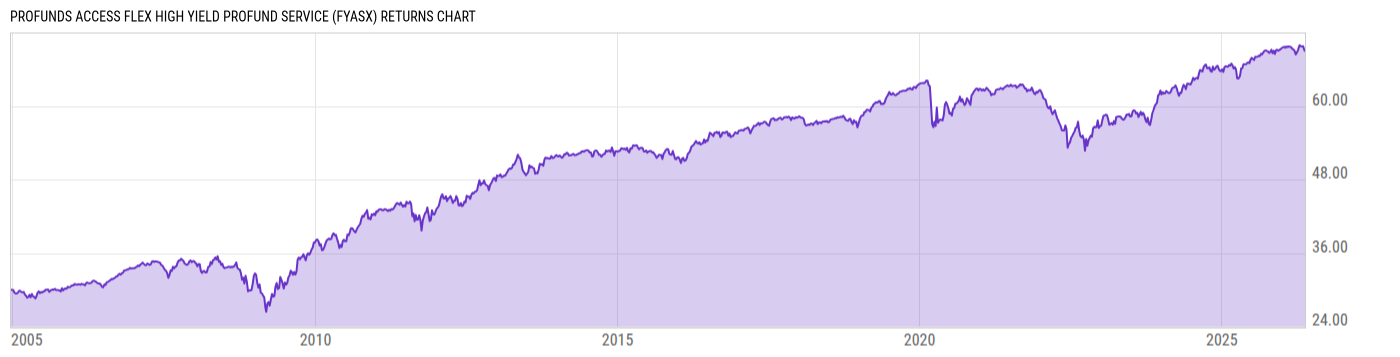
ProFunds Access Flex High Yield ProFund Service (FYASX)
31.08
-0.07
(-0.22%)
USD |
Jun 10 2026
Returns Chart
Key Stats
| Net Expense Ratio | Total Assets Under Management | Weighted Average Dividend Yield | Turnover Ratio (Generic) |
|---|---|---|---|
| 2.75% | 11.30M | -- | 1.31K% |
| 1 Year Fund Level Flows | 1 Year Total Returns (Daily) | Annualized Total Returns Since Inception (Daily) | Max Drawdown (Since Inception) |
| -8.002M | 3.29% |
Basic Info
| Investment Strategy | |
| The Fund seeks to provide investment results that correspond generally to the total return of the high yield market consistent with maintaining reasonable liquidity. If the Fund is successful in meeting its objective, its net asset value should generally gain value as the high yield market is rallying (gaining value). |
| General | |
| Security Type | Mutual Fund |
| Equity Style | -- |
| Broad Asset Class | Taxable Bond |
| Broad Category | Fixed Income |
| Global Peer Group | Bond USD High Yield |
| Peer Group | High Yield Funds |
| Global Macro | Bond High Yield |
| US Macro | High Yield Funds |
| YCharts Categorization | -- |
| YCharts Benchmark | -- |
| Prospectus Objective | High Yield Funds |
| Fund Owner Firm Name | ProFunds |
| Broad Asset Class Benchmark Index | |
| ^BBUSATR | 100.0% |
Net Fund Flows Versus Peer Group
1 Month
% Rank:
64
-2.560B
Peer Group Low
510.03M
Peer Group High
1 Year
% Rank:
45
-8.002M
-2.841B
Peer Group Low
12.05B
Peer Group High
3 Months
% Rank:
37
-2.713B
Peer Group Low
900.82M
Peer Group High
3 Years
% Rank:
47
-4.326B
Peer Group Low
13.55B
Peer Group High
6 Months
% Rank:
45
-2.877B
Peer Group Low
1.301B
Peer Group High
5 Years
% Rank:
34
-9.174B
Peer Group Low
14.79B
Peer Group High
YTD
% Rank:
45
-4.190B
Peer Group Low
1.217B
Peer Group High
10 Years
% Rank:
38
-9.701B
Peer Group Low
21.92B
Peer Group High
Date Unavailable
Risk
Performance Versus Peer Group
Annual Total Returns Versus Peers
As of June 11, 2026.
Asset Allocation
As of January 31, 2026.
| Type | % Net |
|---|---|
| Cash | 100.1% |
| Stock | 0.00% |
| Bond | 0.00% |
| Convertible | 0.00% |
| Preferred | 0.00% |
| Other | -0.06% |
Top 10 Holdings
| Name | % Weight | Price | % Change |
|---|---|---|---|
|
Goldman Sachs International/iShares iBoxx $ High Yield Corporate Bond ETF TRS
|
74.37% | -- | -- |
|
Societe Generale SA Repo
|
26.20% | -- | -- |
|
Natwest Markets Plc REPO
|
20.95% | -- | -- |
|
HSBC Securities USA Inc Repo
|
20.15% | -- | -- |
|
Royal Bank of Canada Repo
|
11.28% | -- | -- |
|
UMB Bank NA Repo
|
11.23% | -- | -- |
|
USD Cash
|
10.25% | -- | -- |
|
UBS AG/iShares iBoxx $ High Yield Corporate Bond ETF TRS
|
-0.01% | -- | -- |
|
Other Assets less Liabilities
|
-0.04% | -- | -- |
|
Goldman Sachs Group Inc/Ishares Iboxx High Yield Corporate Bond ETF TRS
|
-74.39% | -- | -- |
Fees & Availability
| Fees | |
| Actual 12B-1 Fee | 1.00% |
| Actual Management Fee | 0.75% |
| Administration Fee | 13.05K% |
| Maximum Front Load | -- |
| Maximum Deferred Load | -- |
| Maximum Redemption Fee | -- |
| General Availability | |
| Available for Insurance Product | No |
| Available for RRSP | No |
| Purchase Details | |
| Open to New Investors |
|
| Minimum Initial Investment | 15000.00 None |
| Minimum Subsequent Investment | 0.00 None |
Basic Info
| Investment Strategy | |
| The Fund seeks to provide investment results that correspond generally to the total return of the high yield market consistent with maintaining reasonable liquidity. If the Fund is successful in meeting its objective, its net asset value should generally gain value as the high yield market is rallying (gaining value). |
| General | |
| Security Type | Mutual Fund |
| Equity Style | -- |
| Broad Asset Class | Taxable Bond |
| Broad Category | Fixed Income |
| Global Peer Group | Bond USD High Yield |
| Peer Group | High Yield Funds |
| Global Macro | Bond High Yield |
| US Macro | High Yield Funds |
| YCharts Categorization | -- |
| YCharts Benchmark | -- |
| Prospectus Objective | High Yield Funds |
| Fund Owner Firm Name | ProFunds |
| Broad Asset Class Benchmark Index | |
| ^BBUSATR | 100.0% |
Fundamentals
| General | |
| Distribution Yield | -- |
| Dividend Yield TTM (6-10-26) | 0.92% |
| 30-Day SEC Yield (9-30-10) | 0.00% |
| 7-Day SEC Yield | -- |
| Number of Holdings | 10 |
Fund Details
| Key Dates | |
| Inception Date | 12/17/2004 |
| Last Annual Report Date | 7/31/2025 |
| Last Prospectus Date | 11/28/2025 |
| Share Classes | |
| FYAIX | Inv |
| Attributes | |
| Index Fund | -- |
| Inverse Fund | No |
| Leveraged Fund | -- |
| Fund of Funds | No |
| Currency Hedged Fund | -- |
| Socially Responsible Fund | No |
Top Portfolio Holders
| Name | % Weight |
|---|---|
| Portfolio A | 5.00% |
| Portfolio B | 3.50% |
| Portfolio C | 2.25% |
Excel Add-In Codes
| Name: =YCI("M:FYASX", "name") |
| Broad Asset Class: =YCI("M:FYASX", "broad_asset_class") |
| Broad Category: =YCI("M:FYASX", "broad_category_group") |
| Prospectus Objective: =YCI("M:FYASX", "prospectus_objective") |
| To find the codes for any of our securities and financial metrics, see our Complete Excel Reference. |