

Fidelity Instl Tax-Exempt Portfolio Select (FSXXX)
1.00
0.00 (0.00%)
USD |
May 22 2026
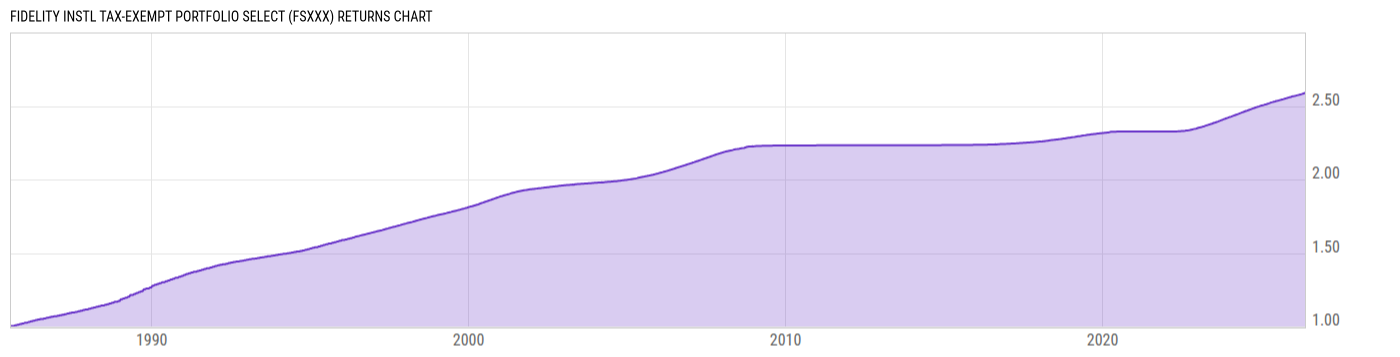
Returns Chart
Key Stats
| Net Expense Ratio | Total Assets Under Management | Weighted Average Dividend Yield | Turnover Ratio (Generic) |
|---|---|---|---|
| 0.23% | 11.89B | -- | -- |
| 1 Year Fund Level Flows | 1 Year Total Returns (Daily) | Annualized Total Returns Since Inception (Daily) | Max Drawdown (Since Inception) |
| 622.76M | 2.37% |
Basic Info
| Investment Strategy | |
| The Fund seeks a high level of interest income exempt from Federal Income Tax as is consistent with a portfolio of high-quality, short term municipal obligations selected on a basis of liquidity and stability of principal. |
| General | |
| Security Type | Money Market Fund |
| Equity Style | -- |
| Broad Asset Class | Money Market |
| Broad Category | Capital Preservation |
| Global Peer Group | Bond USD Tax Exempt Money Market |
| Peer Group | Tax-Exempt Money Market Funds |
| Global Macro | Bond HC |
| US Macro | Tax-Exempt Money Market Funds |
| YCharts Categorization | -- |
| YCharts Benchmark | -- |
| Prospectus Objective | Tax-Exempt Money Market Funds |
| Fund Owner Firm Name | Fidelity Investments |
| Broad Asset Class Benchmark Index | |
| ^BBUTB13MTR | 100.0% |
Net Fund Flows Versus Peer Group
1 Month
% Rank:
72
-1.045B
Peer Group Low
278.77M
Peer Group High
1 Year
% Rank:
17
622.76M
-882.68M
Peer Group Low
1.423B
Peer Group High
3 Months
% Rank:
4
-1.364B
Peer Group Low
1.024B
Peer Group High
3 Years
% Rank:
4
-487.93M
Peer Group Low
5.098B
Peer Group High
6 Months
% Rank:
4
-756.84M
Peer Group Low
1.212B
Peer Group High
5 Years
% Rank:
7
-1.340B
Peer Group Low
6.703B
Peer Group High
YTD
% Rank:
73
-2.133B
Peer Group Low
375.54M
Peer Group High
10 Years
% Rank:
4
-18.10B
Peer Group Low
9.287B
Peer Group High
Date Unavailable
Risk
Performance Versus Peer Group
Annual Total Returns Versus Peers
As of May 24, 2026.
Asset Allocation
As of April 30, 2026.
| Type | % Net |
|---|---|
| Cash | 7.39% |
| Stock | 0.00% |
| Bond | 76.85% |
| Convertible | 0.00% |
| Preferred | 0.00% |
| Other | 15.77% |
Top 10 Holdings
| Name | % Weight | Price | % Change |
|---|---|---|---|
|
FIDELITY SECURITIES LENDING CASH CENTRAL FUND
|
15.77% | -- | -- |
| HARRIS CNTY TEX CULTURAL ED FACS FIN CORP REV TX 1.640 12/01/2060 | 1.12% | 100.00 | 0.00% |
| CONNECTICUT ST CT 1.650 05/15/2034 | 1.10% | 100.00 | 0.00% |
| PORT ARTHUR TEX NAV DIST INDL DEV CORP EXEMPT FACS REV TX 1.800 03/01/2042 | 0.97% | 100.00 | 0.00% |
| COLORADO HEALTH FACS AUTH REV CO 1.620 05/15/2062 | 0.95% | 100.00 | 0.00% |
| INDIANA ST FIN AUTH REV IN 1.750 11/15/2054 | 0.66% | 100.00 | 0.00% |
| J.P. Morgan Securities LLC JPMSEC 05/01/2048 FLT USD Corporate | 0.62% | -- | -- |
| HOUSTON TEX UTIL SYS REV TX 1.660 05/15/2034 | 0.60% | 100.00 | 0.00% |
| MARICOPA CNTY ARIZ INDL DEV AUTH REV AZ 1.660 01/01/2048 | 0.57% | 100.00 | 0.00% |
| LOUISIANA PUB FACS AUTH HOSP REV LA 1.640 09/01/2057 | 0.54% | 100.00 | 0.00% |
Fees & Availability
| Fees | |
| Actual 12B-1 Fee | 0.05% |
| Actual Management Fee | 0.11% |
| Administration Fee | -- |
| Maximum Front Load | -- |
| Maximum Deferred Load | -- |
| Maximum Redemption Fee | -- |
| General Availability | |
| Available for Insurance Product | No |
| Available for RRSP | No |
| Purchase Details | |
| Open to New Investors |
|
| Minimum Initial Investment | 1.00M None |
| Minimum Subsequent Investment | 0.00 None |
Basic Info
| Investment Strategy | |
| The Fund seeks a high level of interest income exempt from Federal Income Tax as is consistent with a portfolio of high-quality, short term municipal obligations selected on a basis of liquidity and stability of principal. |
| General | |
| Security Type | Money Market Fund |
| Equity Style | -- |
| Broad Asset Class | Money Market |
| Broad Category | Capital Preservation |
| Global Peer Group | Bond USD Tax Exempt Money Market |
| Peer Group | Tax-Exempt Money Market Funds |
| Global Macro | Bond HC |
| US Macro | Tax-Exempt Money Market Funds |
| YCharts Categorization | -- |
| YCharts Benchmark | -- |
| Prospectus Objective | Tax-Exempt Money Market Funds |
| Fund Owner Firm Name | Fidelity Investments |
| Broad Asset Class Benchmark Index | |
| ^BBUTB13MTR | 100.0% |
Fundamentals
| General | |
| Distribution Yield | -- |
| Dividend Yield TTM (5-22-26) | 2.34% |
| 30-Day SEC Yield (11-30-24) | 2.92% |
| 7-Day SEC Yield (4-30-26) | 3.12% |
| Number of Holdings | 1021 |
| Bond | |
| Yield to Maturity (4-30-26) | -- |
| Effective Duration | -- |
| Average Coupon | -- |
| Calculated Average Quality | -- |
| Effective Maturity | -- |
| Nominal Maturity | -- |
| Number of Bond Holdings | 935 |
As of April 30, 2026
Fund Details
Top Portfolio Holders
| Name | % Weight |
|---|---|
| Portfolio A | 5.00% |
| Portfolio B | 3.50% |
| Portfolio C | 2.25% |