

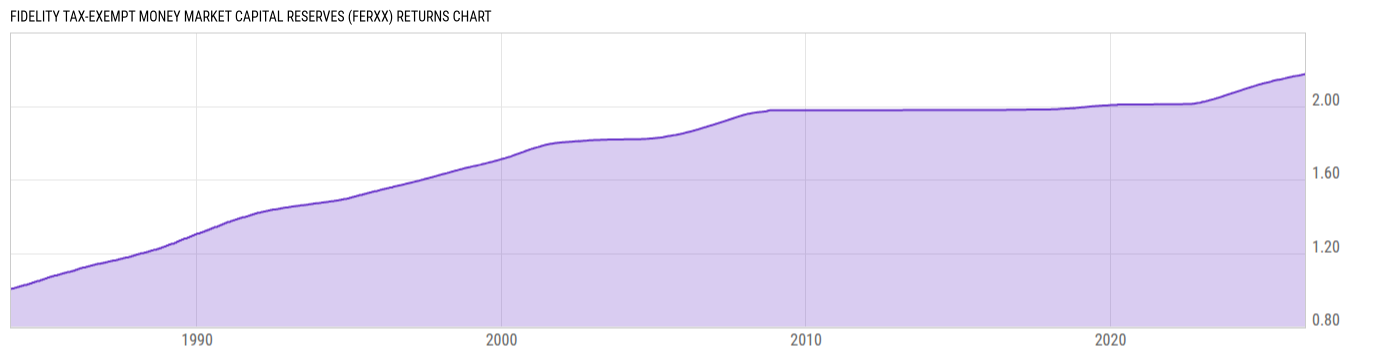
Fidelity Tax-Exempt Money Market Capital Reserves (FERXX)
1.00
0.00 (0.00%)
USD |
May 22 2026
Returns Chart
Key Stats
| Net Expense Ratio | Total Assets Under Management | Weighted Average Dividend Yield | Turnover Ratio (Generic) |
|---|---|---|---|
| 0.95% | 4.236B | -- | -- |
| 1 Year Fund Level Flows | 1 Year Total Returns (Daily) | Annualized Total Returns Since Inception (Daily) | Max Drawdown (Since Inception) |
| -136.42M | 1.54% |
Basic Info
| Investment Strategy | |
| The Fund seeks to provide as high a level of current income, exempt from federal income taxes, as is consistent with liquidity and stability of principal. Invests at least 80% of its assets in municipal money market securities. |
| General | |
| Security Type | Money Market Fund |
| Equity Style | -- |
| Broad Asset Class | Money Market |
| Broad Category | Capital Preservation |
| Global Peer Group | Bond USD Tax Exempt Money Market |
| Peer Group | Tax-Exempt Money Market Funds |
| Global Macro | Bond HC |
| US Macro | Tax-Exempt Money Market Funds |
| YCharts Categorization | -- |
| YCharts Benchmark | -- |
| Prospectus Objective | Tax-Exempt Money Market Funds |
| Fund Owner Firm Name | Fidelity Investments |
| Broad Asset Class Benchmark Index | |
| ^BBUTB13MTR | 100.0% |
Net Fund Flows Versus Peer Group
1 Month
% Rank:
37
-1.045B
Peer Group Low
278.77M
Peer Group High
1 Year
% Rank:
73
-136.42M
-882.68M
Peer Group Low
1.423B
Peer Group High
3 Months
% Rank:
44
-1.364B
Peer Group Low
1.024B
Peer Group High
3 Years
% Rank:
47
-487.93M
Peer Group Low
5.098B
Peer Group High
6 Months
% Rank:
29
-756.84M
Peer Group Low
1.212B
Peer Group High
5 Years
% Rank:
54
-1.340B
Peer Group Low
6.703B
Peer Group High
YTD
% Rank:
44
-2.133B
Peer Group Low
375.54M
Peer Group High
10 Years
% Rank:
89
-18.10B
Peer Group Low
9.287B
Peer Group High
Date Unavailable
Risk
Performance Versus Peer Group
Annual Total Returns Versus Peers
As of May 23, 2026.
Asset Allocation
As of April 30, 2026.
| Type | % Net |
|---|---|
| Cash | 8.12% |
| Stock | 0.00% |
| Bond | 83.50% |
| Convertible | 0.00% |
| Preferred | 0.00% |
| Other | 8.38% |
Top 10 Holdings
| Name | % Weight | Price | % Change |
|---|---|---|---|
|
FIDELITY SECURITIES LENDING CASH CENTRAL FUND
|
8.38% | -- | -- |
| MARICOPA CNTY ARIZ INDL DEV AUTH HOSP REV AZ 1.550 12/01/2054 | 1.58% | 100.00 | 0.00% |
| CONNECTICUT ST CT 1.650 05/15/2034 | 1.37% | 100.00 | 0.00% |
| HARRIS CNTY TEX CULTURAL ED FACS FIN CORP REV TX 1.640 12/01/2060 | 1.11% | 100.00 | 0.00% |
| VALDEZ ALASKA MARINE TERM REV AK 1.630 05/01/2031 | 0.99% | 100.00 | 0.00% |
| CLARK CNTY NEV ARPT REV NV 1.600 07/01/2040 | 0.95% | 100.00 | 0.00% |
| PORT ARTHUR TEX NAV DIST INDL DEV CORP EXEMPT FACS REV TX 1.800 03/01/2042 | 0.85% | 100.00 | 0.00% |
| RIB FLOATER TR VARIOUS STS 06/01/2037 | 0.82% | 100.00 | 0.00% |
| PORT ARTHUR TEX NAV DIST INDL DEV CORP EXEMPT FACS REV TX 1.610 12/01/2040 | 0.82% | 100.00 | 0.00% |
| DELAWARE VALLEY PA REGL FIN AUTH LOC GOVT REV PA 1.610 12/01/2060 | 0.79% | 100.00 | 0.00% |
Fees & Availability
| Fees | |
| Actual 12B-1 Fee | 0.50% |
| Actual Management Fee | 0.23% |
| Administration Fee | -- |
| Maximum Front Load | -- |
| Maximum Deferred Load | -- |
| Maximum Redemption Fee | -- |
| General Availability | |
| Available for Insurance Product | No |
| Available for RRSP | No |
| Purchase Details | |
| Open to New Investors |
|
| Minimum Initial Investment | 0.00 None |
| Minimum Subsequent Investment | 0.00 None |
Basic Info
| Investment Strategy | |
| The Fund seeks to provide as high a level of current income, exempt from federal income taxes, as is consistent with liquidity and stability of principal. Invests at least 80% of its assets in municipal money market securities. |
| General | |
| Security Type | Money Market Fund |
| Equity Style | -- |
| Broad Asset Class | Money Market |
| Broad Category | Capital Preservation |
| Global Peer Group | Bond USD Tax Exempt Money Market |
| Peer Group | Tax-Exempt Money Market Funds |
| Global Macro | Bond HC |
| US Macro | Tax-Exempt Money Market Funds |
| YCharts Categorization | -- |
| YCharts Benchmark | -- |
| Prospectus Objective | Tax-Exempt Money Market Funds |
| Fund Owner Firm Name | Fidelity Investments |
| Broad Asset Class Benchmark Index | |
| ^BBUTB13MTR | 100.0% |
Fundamentals
| General | |
| Distribution Yield | -- |
| Dividend Yield TTM (5-22-26) | 1.64% |
| 30-Day SEC Yield (11-30-24) | 2.23% |
| 7-Day SEC Yield (4-30-26) | 2.38% |
| Number of Holdings | 766 |
| Bond | |
| Yield to Maturity (4-30-26) | -- |
| Effective Duration | -- |
| Average Coupon | -- |
| Calculated Average Quality | -- |
| Effective Maturity | -- |
| Nominal Maturity | -- |
| Number of Bond Holdings | 687 |
As of April 30, 2026
Fund Details
Top Portfolio Holders
| Name | % Weight |
|---|---|
| Portfolio A | 5.00% |
| Portfolio B | 3.50% |
| Portfolio C | 2.25% |