

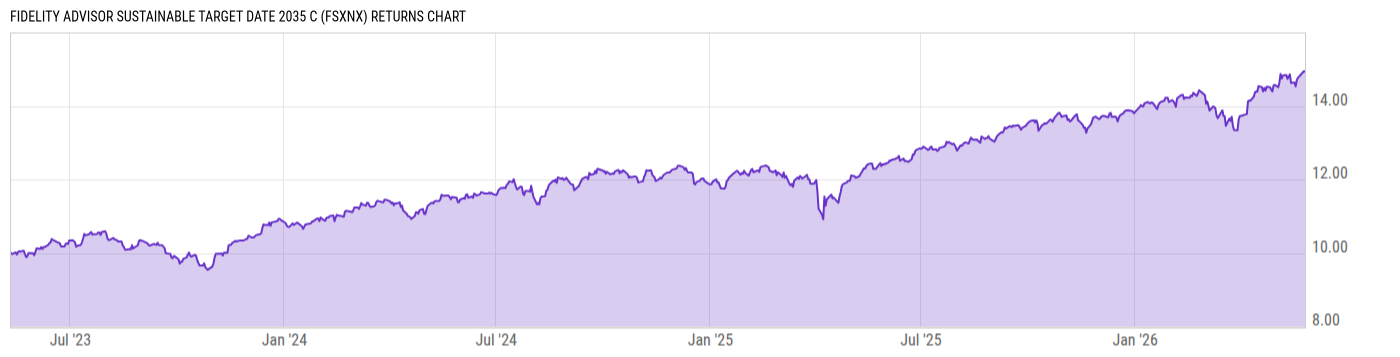
Fidelity Advisor Sustainable Target Date 2035 C (FSXNX)
14.48
-0.01
(-0.07%)
USD |
May 27 2026
Returns Chart
Key Stats
| Net Expense Ratio | Total Assets Under Management | Weighted Average Dividend Yield | Turnover Ratio (Generic) |
|---|---|---|---|
| 1.47% | 13.74M | -- | 39.00% |
| 1 Year Fund Level Flows | 1 Year Total Returns (Daily) | Annualized Total Returns Since Inception (Daily) | Max Drawdown (Since Inception) |
| 6.313M | 19.98% |
Basic Info
| Investment Strategy | |
| The Fund seeks high total return until its target retirement date. Thereafter the funds objective will be to seek high current income andas a secondary objective, capital appreciation. It seeks to achieve its objective by investing in underlying Fidelity funds that the Adviser believes have positive ESG characteristics. |
| General | |
| Security Type | Mutual Fund |
| Equity Style | -- |
| Broad Asset Class | Allocation |
| Broad Category | Allocation |
| Global Peer Group | Target Maturity MA USD 2035 |
| Peer Group | Mixed-Asset Target 2035 Funds |
| Global Macro | Target Maturity |
| US Macro | Mixed-Assets Target Date Funds |
| YCharts Categorization | -- |
| YCharts Benchmark | -- |
| Prospectus Objective | Growth & Income Funds |
| Fund Owner Firm Name | Fidelity Investments |
| Broad Asset Class Benchmark Index | |
| ^SPXTR | 100.0% |
Net Fund Flows Versus Peer Group
1 Month
% Rank:
29
-328.73M
Peer Group Low
240.24M
Peer Group High
1 Year
% Rank:
33
6.313M
-2.383B
Peer Group Low
2.541B
Peer Group High
3 Months
% Rank:
27
-535.23M
Peer Group Low
1.125B
Peer Group High
3 Years
% Rank:
53
-4.186B
Peer Group Low
5.543B
Peer Group High
6 Months
% Rank:
29
-1.382B
Peer Group Low
1.754B
Peer Group High
5 Years
% Rank:
56
-7.787B
Peer Group Low
11.44B
Peer Group High
YTD
% Rank:
32
-968.61M
Peer Group Low
1.371B
Peer Group High
10 Years
% Rank:
68
-15.10B
Peer Group Low
22.32B
Peer Group High
Date Unavailable
Risk
Performance Versus Peer Group
Annual Total Returns Versus Peers
As of May 28, 2026.
Asset Allocation
As of March 31, 2026.
| Type | % Net |
|---|---|
| Cash | 6.74% |
| Stock | 64.41% |
| Bond | 32.87% |
| Convertible | 0.00% |
| Preferred | 0.07% |
| Other | -4.09% |
Top 9 Holdings
| Name | % Weight | Price | % Change |
|---|---|---|---|
| Fidelity Series Sustainable US Market Fund | 36.75% | 18.32 | -0.11% |
| Fidelity Series Sustainable Non-US Developed Mkt | 20.55% | 14.83 | -0.47% |
| Fidelity Series Sustainable Investment Grade Bd Fd | 18.72% | 9.64 | 0.00% |
| Fidelity Series Sustainable Emerging Markets Fund | 9.65% | 18.33 | 0.38% |
| Fidelity Series Long-Term Treasury Bond Index Fund | 5.63% | 5.26 | 0.19% |
| Fidelity Series International Developed Mkts Bd Id | 4.33% | 8.46 | 0.00% |
| Fidelity Series 5+ Year Inflation-Protected Bd Idx | 3.85% | 7.66 | 0.13% |
| Fidelity Series Treasury Bill Index Fund | 0.49% | 9.95 | 0.00% |
|
Other Assets less Liabilities
|
0.05% | -- | -- |
Fees & Availability
| Fees | |
| Actual 12B-1 Fee | 1.00% |
| Actual Management Fee | 0.47% |
| Administration Fee | -- |
| Maximum Front Load | -- |
| Maximum Deferred Load | 1.00% |
| Maximum Redemption Fee | -- |
| General Availability | |
| Available for Insurance Product | No |
| Available for RRSP | No |
| Purchase Details | |
| Open to New Investors |
|
| Minimum Initial Investment | 0.00 None |
| Minimum Subsequent Investment | 0.00 None |
Basic Info
| Investment Strategy | |
| The Fund seeks high total return until its target retirement date. Thereafter the funds objective will be to seek high current income andas a secondary objective, capital appreciation. It seeks to achieve its objective by investing in underlying Fidelity funds that the Adviser believes have positive ESG characteristics. |
| General | |
| Security Type | Mutual Fund |
| Equity Style | -- |
| Broad Asset Class | Allocation |
| Broad Category | Allocation |
| Global Peer Group | Target Maturity MA USD 2035 |
| Peer Group | Mixed-Asset Target 2035 Funds |
| Global Macro | Target Maturity |
| US Macro | Mixed-Assets Target Date Funds |
| YCharts Categorization | -- |
| YCharts Benchmark | -- |
| Prospectus Objective | Growth & Income Funds |
| Fund Owner Firm Name | Fidelity Investments |
| Broad Asset Class Benchmark Index | |
| ^SPXTR | 100.0% |
Fundamentals
| General | |
| Distribution Yield | -- |
| Dividend Yield TTM (5-26-26) | 0.80% |
| 30-Day SEC Yield (10-3-23) | 0.00% |
| 7-Day SEC Yield (10-3-23) | 0.00% |
| Number of Holdings | 9 |
| Stock | |
| Weighted Average PE Ratio | 30.16 |
| Weighted Average Price to Sales Ratio | 6.973 |
| Weighted Average Price to Book Ratio | 8.207 |
| Weighted Median ROE | 48.31% |
| Weighted Median ROA | 12.66% |
| ROI (TTM) | 19.13% |
| Return on Investment (TTM) | 19.13% |
| Earning Yield | 0.0431 |
| LT Debt / Shareholders Equity | 0.7151 |
| Number of Equity Holdings | 0 |
| Bond | |
| Yield to Maturity (3-31-26) | 4.12% |
| Effective Duration | -- |
| Average Coupon | 3.44% |
| Calculated Average Quality | 2.118 |
| Effective Maturity | 13.28 |
| Nominal Maturity | 13.30 |
| Number of Bond Holdings | 0 |
As of March 31, 2026
Growth Metrics
| EPS Growth (1Y) | 25.19% |
| EPS Growth (3Y) | 18.32% |
| EPS Growth (5Y) | 22.71% |
| Sales Growth (1Y) | 13.29% |
| Sales Growth (3Y) | 12.48% |
| Sales Growth (5Y) | 13.55% |
| Sales per Share Growth (1Y) | 21.73% |
| Sales per Share Growth (3Y) | 13.29% |
| Operating Cash Flow - Growth Rate (3Y) | 22.42% |
As of March 31, 2026
Fund Details
| Key Dates | |
| Inception Date | 5/11/2023 |
| Last Annual Report Date | 3/31/2025 |
| Last Prospectus Date | 5/30/2025 |
| Share Classes | |
| FSXKX | Direct Sold |
| FSXLX | A |
| FSXOX | M |
| FSXQX | Inst |
| FSXRX | Z |
| FSXTX | K |
| FSXUX | Other |
| Attributes | |
| Index Fund | -- |
| Inverse Fund | No |
| Leveraged Fund | -- |
| Fund of Funds |
|
| Currency Hedged Fund | -- |
| Socially Responsible Fund |
|
Top Portfolio Holders
| Name | % Weight |
|---|---|
| Portfolio A | 5.00% |
| Portfolio B | 3.50% |
| Portfolio C | 2.25% |
Excel Add-In Codes
| Name: =YCI("M:FSXNX", "name") |
| Broad Asset Class: =YCI("M:FSXNX", "broad_asset_class") |
| Broad Category: =YCI("M:FSXNX", "broad_category_group") |
| Prospectus Objective: =YCI("M:FSXNX", "prospectus_objective") |
| To find the codes for any of our securities and financial metrics, see our Complete Excel Reference. |