

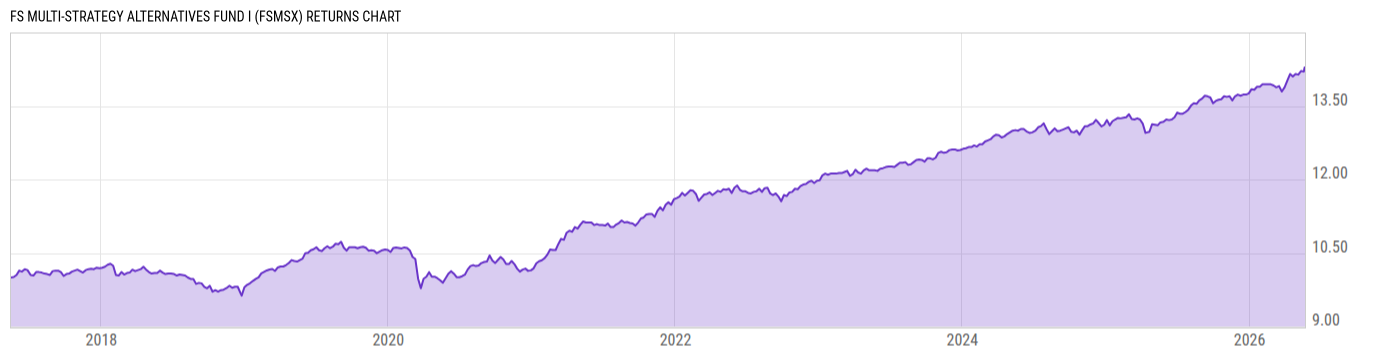
FS Multi-Strategy Alternatives Fund I (FSMSX)
11.55
+0.01
(+0.09%)
USD |
Jun 09 2026
Returns Chart
Key Stats
| Net Expense Ratio | Total Assets Under Management | Weighted Average Dividend Yield | Turnover Ratio (Generic) |
|---|---|---|---|
| 2.02% | 1.480B | -- | 636.0% |
| 1 Year Fund Level Flows | 1 Year Total Returns (Daily) | Annualized Total Returns Since Inception (Daily) | Max Drawdown (Since Inception) |
| -420.52M | 7.96% |
Basic Info
| Investment Strategy | |
| The Fund seeks to provide shareholders with positive absolute returns over a complete market cycle. It will actively allocate its assets across a broad spectrum of alternative investment strategies. The fund will seek to provide exposure to alternative strategies with low correlation to equity and fixed income markets. |
| General | |
| Security Type | Mutual Fund |
| Equity Style | -- |
| Broad Asset Class | Alternative |
| Broad Category | Alternative Strategies |
| Global Peer Group | Alternative Multi Strategies |
| Peer Group | Alternative Multi-Strategy Funds |
| Global Macro | Liquid Alternatives |
| US Macro | Alternative Equity Funds |
| YCharts Categorization | -- |
| YCharts Benchmark | -- |
| Prospectus Objective | Alternative Multi-Strategy Funds |
| Fund Owner Firm Name | Future Standard |
| Broad Asset Class Benchmark Index | |
| ^MSACWINTR | 100.0% |
Net Fund Flows Versus Peer Group
1 Month
% Rank:
93
-140.05M
Peer Group Low
558.92M
Peer Group High
1 Year
% Rank:
96
-420.52M
-552.08M
Peer Group Low
4.649B
Peer Group High
3 Months
% Rank:
100
-74.70M
Peer Group Low
1.340B
Peer Group High
3 Years
% Rank:
15
-1.663B
Peer Group Low
6.757B
Peer Group High
6 Months
% Rank:
100
-244.92M
Peer Group Low
2.749B
Peer Group High
5 Years
% Rank:
12
-2.277B
Peer Group Low
7.050B
Peer Group High
YTD
% Rank:
100
-195.06M
Peer Group Low
2.292B
Peer Group High
10 Years
% Rank:
17
-3.121B
Peer Group Low
7.072B
Peer Group High
Date Unavailable
Risk
Performance Versus Peer Group
Annual Total Returns Versus Peers
As of June 10, 2026.
Asset Allocation
As of December 31, 2025.
| Type | % Net |
|---|---|
| Cash | 19.15% |
| Stock | -4.01% |
| Bond | 94.71% |
| Convertible | 0.77% |
| Preferred | 1.13% |
| Other | -11.74% |
Top 10 Holdings
| Name | % Weight | Price | % Change |
|---|---|---|---|
|
Federal National Mortgage Association 5.5% 01-JAN-2056
|
70.08% | -- | -- |
|
Federal National Mortgage Association 5% 01-JAN-2056
|
45.35% | -- | -- |
| BlackRock Cash Funds: Treasury Institutional | 15.48% | 1.00 | 0.00% |
|
Barclays Bank PLC 0% 29-DEC-2025
|
10.82% | -- | -- |
|
Cash and Cash Equivalents
|
10.38% | -- | -- |
|
USD Cash
|
3.01% | -- | -- |
|
Barclays Bank PLC 0% 29-DEC-2025
|
2.17% | -- | -- |
|
Barclays Bank PLC 0% 29-DEC-2025
|
2.05% | -- | -- |
| United States of America USGB 02/19/2026 FIX USD Government (Matured) | 1.53% | 100.00 | 0.00% |
| iShares Bitcoin Trust ETF | 1.41% | 35.00 | -0.40% |
Fees & Availability
| Fees | |
| Actual 12B-1 Fee | -- |
| Actual Management Fee | 1.22% |
| Administration Fee | 1.20M% |
| Maximum Front Load | -- |
| Maximum Deferred Load | -- |
| Maximum Redemption Fee | -- |
| General Availability | |
| Available for Insurance Product | No |
| Available for RRSP | No |
| Purchase Details | |
| Open to New Investors |
|
| Minimum Initial Investment | 1.00M None |
| Minimum Subsequent Investment | 0.00 None |
Basic Info
| Investment Strategy | |
| The Fund seeks to provide shareholders with positive absolute returns over a complete market cycle. It will actively allocate its assets across a broad spectrum of alternative investment strategies. The fund will seek to provide exposure to alternative strategies with low correlation to equity and fixed income markets. |
| General | |
| Security Type | Mutual Fund |
| Equity Style | -- |
| Broad Asset Class | Alternative |
| Broad Category | Alternative Strategies |
| Global Peer Group | Alternative Multi Strategies |
| Peer Group | Alternative Multi-Strategy Funds |
| Global Macro | Liquid Alternatives |
| US Macro | Alternative Equity Funds |
| YCharts Categorization | -- |
| YCharts Benchmark | -- |
| Prospectus Objective | Alternative Multi-Strategy Funds |
| Fund Owner Firm Name | Future Standard |
| Broad Asset Class Benchmark Index | |
| ^MSACWINTR | 100.0% |
Fundamentals
| General | |
| Distribution Yield | -- |
| Dividend Yield TTM (6-8-26) | 2.33% |
| 30-Day SEC Yield | -- |
| 7-Day SEC Yield | -- |
| Number of Holdings | 637 |
| Bond | |
| Yield to Maturity (12-31-25) | 4.92% |
| Effective Duration | -- |
| Average Coupon | 5.93% |
| Calculated Average Quality | 1.824 |
| Effective Maturity | 21.96 |
| Nominal Maturity | 22.04 |
| Number of Bond Holdings | 519 |
As of December 31, 2025
Fund Details
| Key Dates | |
| Inception Date | 5/16/2017 |
| Last Annual Report Date | 12/31/2025 |
| Last Prospectus Date | 5/1/2026 |
| Share Classes | |
| FSMMX | A |
| Attributes | |
| Index Fund | -- |
| Inverse Fund | No |
| Leveraged Fund | -- |
| Fund of Funds | No |
| Currency Hedged Fund | -- |
| Socially Responsible Fund | No |
Top Portfolio Holders
| Name | % Weight |
|---|---|
| Portfolio A | 5.00% |
| Portfolio B | 3.50% |
| Portfolio C | 2.25% |
Excel Add-In Codes
| Name: =YCI("M:FSMSX", "name") |
| Broad Asset Class: =YCI("M:FSMSX", "broad_asset_class") |
| Broad Category: =YCI("M:FSMSX", "broad_category_group") |
| Prospectus Objective: =YCI("M:FSMSX", "prospectus_objective") |
| To find the codes for any of our securities and financial metrics, see our Complete Excel Reference. |