

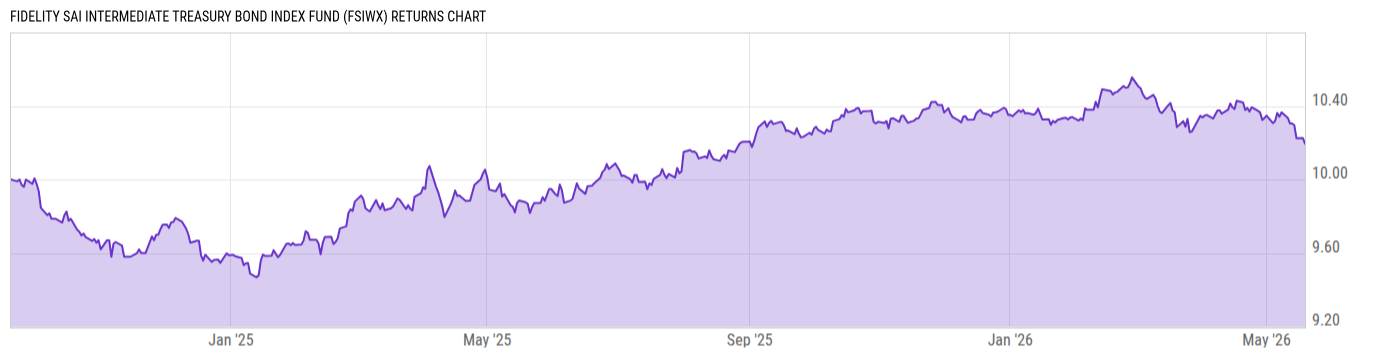
Fidelity SAI Intermediate Treasury Bond Index Fund (FSIWX)
9.69
-0.01
(-0.10%)
USD |
Jun 08 2026
Returns Chart
Key Stats
| Net Expense Ratio | Total Assets Under Management | Weighted Average Dividend Yield | Turnover Ratio (Generic) |
|---|---|---|---|
| 0.03% | 1.492B | -- | 43.00% |
| 1 Year Fund Level Flows | 1 Year Total Returns (Daily) | Annualized Total Returns Since Inception (Daily) | Max Drawdown (Since Inception) |
| -1.338B | 3.88% |
Basic Info
| Investment Strategy | |
| The Fund seeks a high level of current income. Normally investing at least 80% of assets in securities included in the Bloomberg US 5-10 Year Treasury Bond Index, a market value-weighted index of investment-grade fixed-rate public obligations of the US Treasury with maturities between five and ten years. |
| General | |
| Security Type | Mutual Fund |
| Equity Style | -- |
| Broad Asset Class | Taxable Bond |
| Broad Category | Fixed Income |
| Global Peer Group | Bond USD Government |
| Peer Group | General U.S. Treasury Funds |
| Global Macro | Bond Government |
| US Macro | U.S. Government & Treasury Fixed Income Funds |
| YCharts Categorization | -- |
| YCharts Benchmark | -- |
| Prospectus Objective | General U.S. Treasury Funds |
| Fund Owner Firm Name | Fidelity Investments |
| Broad Asset Class Benchmark Index | |
| ^BBUSATR | 100.0% |
Net Fund Flows Versus Peer Group
1 Month
% Rank:
100
-2.909B
Peer Group Low
2.401B
Peer Group High
1 Year
% Rank:
97
-1.338B
-9.892B
Peer Group Low
13.44B
Peer Group High
3 Months
% Rank:
100
-2.663B
Peer Group Low
6.330B
Peer Group High
3 Years
% Rank:
20
-6.948B
Peer Group Low
17.83B
Peer Group High
6 Months
% Rank:
98
-5.476B
Peer Group Low
8.554B
Peer Group High
5 Years
% Rank:
27
-2.143B
Peer Group Low
37.80B
Peer Group High
YTD
% Rank:
98
-4.497B
Peer Group Low
8.369B
Peer Group High
10 Years
% Rank:
28
-803.46M
Peer Group Low
39.10B
Peer Group High
Date Unavailable
Risk
Performance Versus Peer Group
Annual Total Returns Versus Peers
As of June 09, 2026.
Asset Allocation
As of April 30, 2026.
| Type | % Net |
|---|---|
| Cash | 0.24% |
| Stock | 0.00% |
| Bond | 99.29% |
| Convertible | 0.00% |
| Preferred | 0.00% |
| Other | 0.47% |
Top 10 Holdings
| Name | % Weight | Price | % Change |
|---|---|---|---|
| United States of America USGB 3.875 08/15/2033 FIX USD Government | 17.32% | 96.78 | 0.23% |
| United States of America USGB 4.625 02/15/2035 FIX USD Government | 10.49% | 101.03 | 0.26% |
| United States of America USGB 2.875 05/15/2032 FIX USD Government | 8.85% | 92.46 | 0.20% |
| United States of America USGB 1.875 02/15/2032 FIX USD Government | 7.82% | 87.80 | 0.20% |
| United States of America USGB 4.0 02/15/2034 FIX USD Government | 7.47% | 97.20 | 0.24% |
| United States of America USGB 4.125 11/15/2032 FIX USD Government | 7.20% | 98.70 | 0.20% |
| United States of America USGB 4.25 08/15/2035 FIX USD Government | 7.10% | 98.10 | 0.28% |
| United States of America USGB 1.25 08/15/2031 FIX USD Government | 5.36% | 86.04 | 0.19% |
| United States of America USGB 3.5 02/15/2033 FIX USD Government | 4.30% | 94.95 | 0.22% |
| United States of America USGB 1.375 11/15/2031 FIX USD Government | 3.54% | 85.95 | 0.20% |
Fees & Availability
| Fees | |
| Actual 12B-1 Fee | -- |
| Actual Management Fee | 0.02% |
| Administration Fee | -- |
| Maximum Front Load | -- |
| Maximum Deferred Load | -- |
| Maximum Redemption Fee | -- |
| General Availability | |
| Available for Insurance Product | No |
| Available for RRSP | No |
| Purchase Details | |
| Open to New Investors |
|
| Minimum Initial Investment | 0.00 None |
| Minimum Subsequent Investment | 0.00 None |
Basic Info
| Investment Strategy | |
| The Fund seeks a high level of current income. Normally investing at least 80% of assets in securities included in the Bloomberg US 5-10 Year Treasury Bond Index, a market value-weighted index of investment-grade fixed-rate public obligations of the US Treasury with maturities between five and ten years. |
| General | |
| Security Type | Mutual Fund |
| Equity Style | -- |
| Broad Asset Class | Taxable Bond |
| Broad Category | Fixed Income |
| Global Peer Group | Bond USD Government |
| Peer Group | General U.S. Treasury Funds |
| Global Macro | Bond Government |
| US Macro | U.S. Government & Treasury Fixed Income Funds |
| YCharts Categorization | -- |
| YCharts Benchmark | -- |
| Prospectus Objective | General U.S. Treasury Funds |
| Fund Owner Firm Name | Fidelity Investments |
| Broad Asset Class Benchmark Index | |
| ^BBUSATR | 100.0% |
Fundamentals
| General | |
| Distribution Yield | -- |
| Dividend Yield TTM (6-8-26) | 3.57% |
| 30-Day SEC Yield (5-31-26) | 4.32% |
| 7-Day SEC Yield | -- |
| Number of Holdings | 23 |
| Bond | |
| Yield to Maturity (4-30-26) | 4.21% |
| Effective Duration | -- |
| Average Coupon | 3.52% |
| Calculated Average Quality | 2.00 |
| Effective Maturity | 7.006 |
| Nominal Maturity | 7.006 |
| Number of Bond Holdings | 21 |
As of April 30, 2026
Fund Details
| Key Dates | |
| Inception Date | 9/20/2024 |
| Last Annual Report Date | 2/28/2026 |
| Last Prospectus Date | 4/29/2026 |
| Attributes | |
| Index Fund |
|
| Inverse Fund | No |
| Leveraged Fund | -- |
| Fund of Funds | No |
| Currency Hedged Fund | -- |
| Socially Responsible Fund | No |
Top Portfolio Holders
| Name | % Weight |
|---|---|
| Portfolio A | 5.00% |
| Portfolio B | 3.50% |
| Portfolio C | 2.25% |
Excel Add-In Codes
| Name: =YCI("M:FSIWX", "name") |
| Broad Asset Class: =YCI("M:FSIWX", "broad_asset_class") |
| Broad Category: =YCI("M:FSIWX", "broad_category_group") |
| Prospectus Objective: =YCI("M:FSIWX", "prospectus_objective") |
| To find the codes for any of our securities and financial metrics, see our Complete Excel Reference. |