

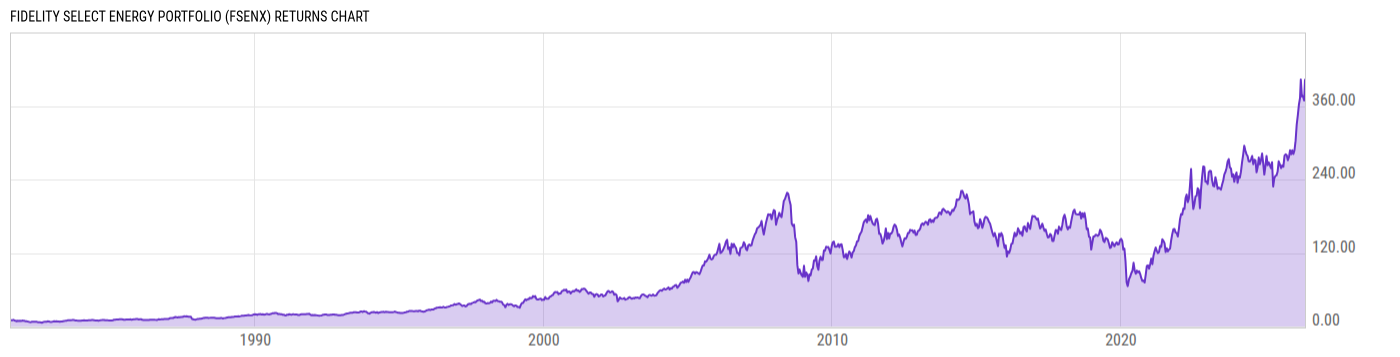
Fidelity Select Energy Portfolio (FSENX)
81.61
-1.43
(-1.72%)
USD |
Jun 09 2026
Returns Chart
Key Stats
| Net Expense Ratio | Total Assets Under Management | Weighted Average Dividend Yield | Turnover Ratio (Generic) |
|---|---|---|---|
| 0.65% | 4.006B | 2.07% | 14.00% |
| 1 Year Fund Level Flows | 1 Year Total Returns (Daily) | Annualized Total Returns Since Inception (Daily) | Max Drawdown (Since Inception) |
| 66.72M | 49.15% |
Basic Info
| Investment Strategy | |
| The Fund seeks capital appreciation. The Fund normally invests at least 80% of assets in securities of companies principally engaged in the energy field, including the conventional areas of oil, gas, electricity, and coal, and newer sources of energy such as nuclear, geothermal, oil shale, and solar power. |
| General | |
| Security Type | Mutual Fund |
| Equity Style | Multi Cap Value |
| Broad Asset Class | Sector Equity |
| Broad Category | Equity |
| Global Peer Group | Equity Theme - Natural Resources |
| Peer Group | Natural Resources Funds |
| Global Macro | Equity Theme |
| US Macro | Sector Equity Funds |
| YCharts Categorization | -- |
| YCharts Benchmark | -- |
| Prospectus Objective | Natural Resources Funds |
| Fund Owner Firm Name | Fidelity Investments |
| Broad Asset Class Benchmark Index | |
| ^MSWNTR | 100.0% |
Net Fund Flows Versus Peer Group
1 Month
% Rank:
99
-560.25M
Peer Group Low
796.73M
Peer Group High
1 Year
% Rank:
17
66.72M
-334.35M
Peer Group Low
1.548B
Peer Group High
3 Months
% Rank:
7
-312.81M
Peer Group Low
947.26M
Peer Group High
3 Years
% Rank:
95
-9.916B
Peer Group Low
662.44M
Peer Group High
6 Months
% Rank:
13
-205.60M
Peer Group Low
3.797B
Peer Group High
5 Years
% Rank:
88
-15.89B
Peer Group Low
662.44M
Peer Group High
YTD
% Rank:
11
-154.42M
Peer Group Low
4.414B
Peer Group High
10 Years
% Rank:
94
-8.575B
Peer Group Low
662.44M
Peer Group High
Date Unavailable
Risk
Performance Versus Peer Group
Annual Total Returns Versus Peers
As of June 10, 2026.
Asset Allocation
As of April 30, 2026.
| Type | % Net |
|---|---|
| Cash | 0.05% |
| Stock | 96.16% |
| Bond | 0.10% |
| Convertible | 0.00% |
| Preferred | 0.00% |
| Other | 3.69% |
Top 10 Holdings
| Name | % Weight | Price | % Change |
|---|---|---|---|
| Exxon Mobil Corp. | 23.60% | 150.17 | 0.85% |
| Chevron Corp. | 11.01% | 188.97 | 1.18% |
| Cenovus Energy, Inc. | 5.39% | 28.14 | 1.75% |
| Marathon Petroleum Corp. | 4.83% | 260.42 | 0.88% |
| TechnipFMC plc | 4.40% | 68.94 | 0.80% |
| National Energy Services Reunited Corp. | 4.25% | 24.19 | 0.54% |
| Baker Hughes Co. | 4.00% | 63.60 | 0.08% |
| Cheniere Energy, Inc. | 3.97% | 241.01 | 0.67% |
| Valero Energy Corp. | 3.93% | 255.42 | 0.65% |
| SLB Ltd. | 3.83% | 55.92 | 0.12% |
Fees & Availability
| Fees | |
| Actual 12B-1 Fee | -- |
| Actual Management Fee | 0.63% |
| Administration Fee | -- |
| Maximum Front Load | 0.00% |
| Maximum Deferred Load | -- |
| Maximum Redemption Fee | 0.00% |
| General Availability | |
| Available for Insurance Product | No |
| Available for RRSP | No |
| Purchase Details | |
| Open to New Investors |
|
| Minimum Initial Investment | 0.00 None |
| Minimum Subsequent Investment | 0.00 None |
Basic Info
| Investment Strategy | |
| The Fund seeks capital appreciation. The Fund normally invests at least 80% of assets in securities of companies principally engaged in the energy field, including the conventional areas of oil, gas, electricity, and coal, and newer sources of energy such as nuclear, geothermal, oil shale, and solar power. |
| General | |
| Security Type | Mutual Fund |
| Equity Style | Multi Cap Value |
| Broad Asset Class | Sector Equity |
| Broad Category | Equity |
| Global Peer Group | Equity Theme - Natural Resources |
| Peer Group | Natural Resources Funds |
| Global Macro | Equity Theme |
| US Macro | Sector Equity Funds |
| YCharts Categorization | -- |
| YCharts Benchmark | -- |
| Prospectus Objective | Natural Resources Funds |
| Fund Owner Firm Name | Fidelity Investments |
| Broad Asset Class Benchmark Index | |
| ^MSWNTR | 100.0% |
Fundamentals
| General | |
| Distribution Yield | -- |
| Dividend Yield TTM (6-8-26) | 1.61% |
| 30-Day SEC Yield (10-3-23) | 0.00% |
| 7-Day SEC Yield (10-3-23) | 0.00% |
| Number of Holdings | 34 |
| Stock | |
| Weighted Average PE Ratio | 24.86 |
| Weighted Average Price to Sales Ratio | 2.291 |
| Weighted Average Price to Book Ratio | 3.952 |
| Weighted Median ROE | 16.49% |
| Weighted Median ROA | 6.57% |
| ROI (TTM) | 8.28% |
| Return on Investment (TTM) | 8.28% |
| Earning Yield | 0.0460 |
| LT Debt / Shareholders Equity | 0.6683 |
| Number of Equity Holdings | 31 |
As of April 30, 2026
Growth Metrics
| EPS Growth (1Y) | 0.22% |
| EPS Growth (3Y) | -6.86% |
| EPS Growth (5Y) | 27.08% |
| Sales Growth (1Y) | 2.32% |
| Sales Growth (3Y) | -2.75% |
| Sales Growth (5Y) | 15.19% |
| Sales per Share Growth (1Y) | 1.86% |
| Sales per Share Growth (3Y) | -2.40% |
| Operating Cash Flow - Growth Rate (3Y) | 2.75% |
As of April 30, 2026
Fund Details
Top Portfolio Holders
| Name | % Weight |
|---|---|
| Portfolio A | 5.00% |
| Portfolio B | 3.50% |
| Portfolio C | 2.25% |
Excel Add-In Codes
| Name: =YCI("M:FSENX", "name") |
| Broad Asset Class: =YCI("M:FSENX", "broad_asset_class") |
| Broad Category: =YCI("M:FSENX", "broad_category_group") |
| Prospectus Objective: =YCI("M:FSENX", "prospectus_objective") |
| To find the codes for any of our securities and financial metrics, see our Complete Excel Reference. |